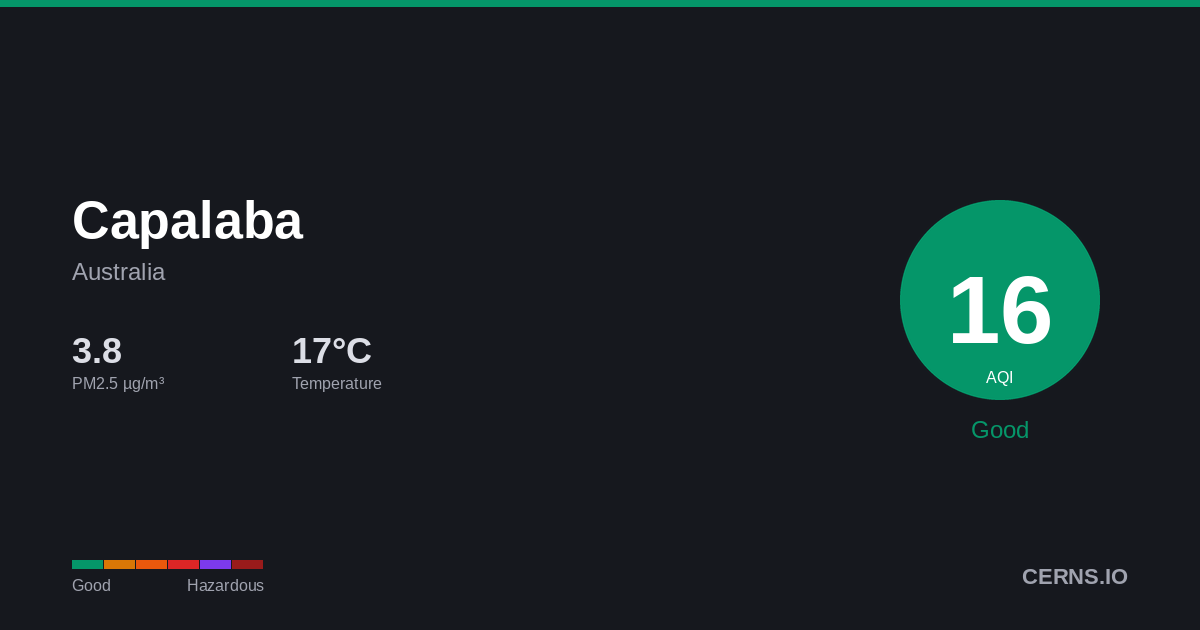
Air Quality in Capalaba, Australia
Clear
16.8°C · 37.5% humidity
16.8°
Feels 16.8°
16
Good
Air quality is satisfactory. Enjoy outdoor activities.
15 stations
Nearby Monitoring Stations
Capalaba's air quality — share it
AQI Forecast
Calibrated
19
12pm
19
19
16
3pm
19
19
0
6pm
0
0
0
9pm
0
0
0
12am
0
0
0
3am
0
0
0
6am
0
0
0
9am
0
19
Station readings
12
5
4
CAMS model
adj -35
54
54
54
54
54
54
34
34
34
34
34
34
34
34
34
27
27
27
27
27
27
27
27
54
Air Quality Index Trend
47h · 1 stnCapalaba's air quality is generally good but can be impacted by bushfire smoke, dust storms, and vehicle emissions. Seasonal fire events can cause significant temporary air quality deterioration.
37.5%
Humidity
16.7 km/h
Wind NNE
1017.1 hPa
Pressure
4.4
UV Moderate
GoodModerateUSGUnhealthyVery UnhealthyHazardous
Which pollutant is driving the AQI?
PM2.5
3.76 µg/m³
PM10▲
20.55 µg/m³
050100150200300500
What is the weather forecast for Capalaba?
Temperature & Precipitation
PM2.5 Trend
47h · 1 stationPM2.53.76 µg/m³
✓ WHO
Good
PM1020.55 µg/m³
Good
UV INDEX4.4
Moderate
Station readings (15 stations within 25 km)
3.76
Median
3.99
Average
1.72
Low
6.0
High
PM2.5 µg/m³ · Model: 9.65 · Bias: +5.9
What is the 7-day forecast for Capalaba?
06-09
16.8° 10.7°
06-10
19.4° 14.2°
4.56 mm
06-11
19.4° 11.2°
06-12
17.7° 12.5°
0.06 mm
06-13
20.8° 13.1°
3.06 mm
06-14
20.2° 14.8°
5.25 mm
06-15
20.3° 14.1°
0.31 mm
Both models agree
Avg diff: 1.8°C
Where are air quality stations near Capalaba?
16
Springwood
46
Springwood
24
Springwood
48
Springwood
9
Springwood
55
Wynnum
38
Deception Bay
46
Wynnum
57
Cannon Hill
44
Cannon Hill
What cities are near Capalaba?
Get AQI alerts for Capalaba
Notify me when air quality reaches:
Free · No account · Unsubscribe any time
Data sources: AQI from ground-level monitoring stations via AQICN. Weather forecast from ECMWF (IFS & CAMS models). AQI calculated using US EPA standard. Updated 2026-06-09T05:00 UTC.