Air Quality in Liverpool, Australia
Windy
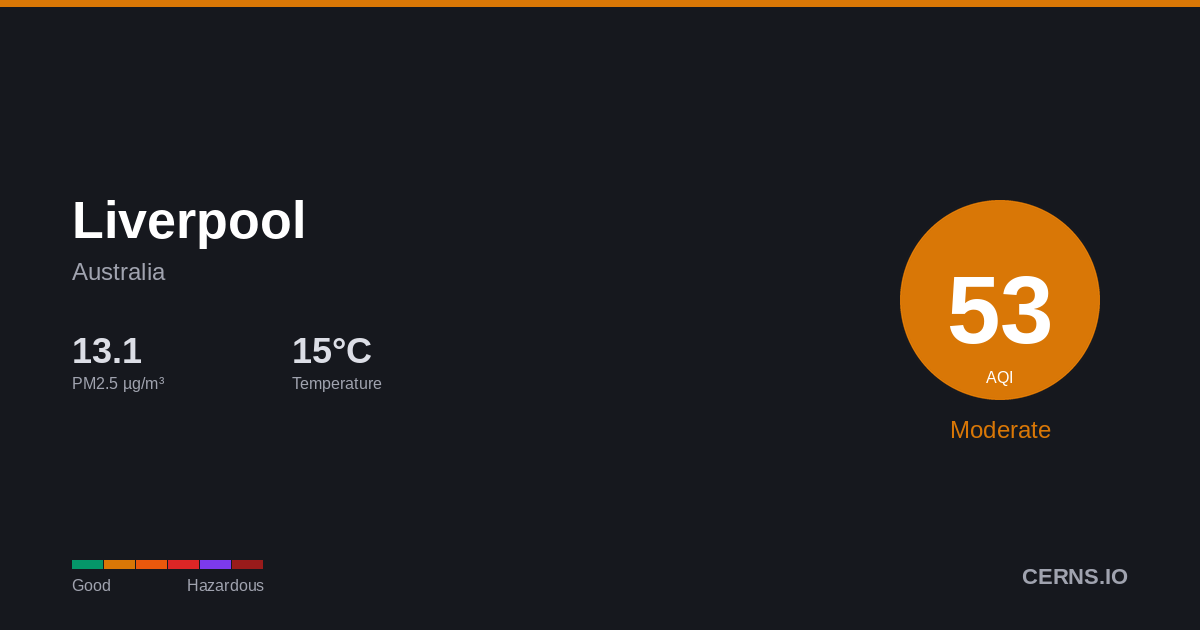
15.3°C · 49.4% humidity
15.3°
Feels 15.3°
53
Moderate
Unusually sensitive people should consider reducing prolonged outdoor exertion.
1 station
Nearby Monitoring Stations
Liverpool's air quality — share it
AQI Forecast
Calibrated
75
9am
75
55
53
12pm
55
55
55
3pm
75
75
75
6pm
87
87
87
9pm
104
87
104
12am
104
104
87
3am
87
87
87
6am
87
87
Station readings
88
74
55
CAMS model
adj +21
54
54
34
34
34
34
34
54
54
54
66
66
66
83
66
83
83
83
66
66
66
66
66
66
Air Quality Index Trend
45h · 1 stnLiverpool's air quality is generally good but can be impacted by bushfire smoke, dust storms, and vehicle emissions. Seasonal fire events can cause significant temporary air quality deterioration.
49.4%
Humidity
67.5 km/h
Wind WSW
1016.3 hPa
Pressure
5.9
UV High
GoodModerateUSGUnhealthyVery UnhealthyHazardous
Which pollutant is driving the AQI?
PM2.5▲
13.18 µg/m³
PM10
27.45 µg/m³
050100150200300500
What is the weather forecast for Liverpool?
Temperature & Precipitation
PM2.5 Trend
45h · 1 stationPM2.513.18 µg/m³
✓ WHO
Moderate
PM1027.45 µg/m³
Good
UV INDEX5.9
High
Station readings (1 station within 25 km)
13.18
Median
13.18
Average
13.18
Low
13.18
High
PM2.5 µg/m³ · Model: 13.7 · Bias: +0.5
What is the 7-day forecast for Liverpool?
06-09
15.3° 9.1°
0.5 mm
06-10
16.6° 11.4°
0.31 mm
06-11
17.0° 4.4°
0.19 mm
06-12
16.0° 9.2°
0.06 mm
06-13
16.7° 8.8°
06-14
17.1° 14.9°
28.44 mm
06-15
18.8° 9.4°
0.06 mm
Both models agree
Avg diff: 2.8°C
Where are air quality stations near Liverpool?
13
Liverpool Sydney South-west
50
Liverpool Sydney South-west
41
Liverpool Sydney South-west
9
Liverpool Sydney South-west
61
Liverpool Sydney South-west
42
Liverpool Sydney South-west
65
Liverpool Sydney South-west
19
Liverpool Sydney South-west
73
Liverpool Sydney South-west
29
Liverpool Sydney South-west
What cities are near Liverpool?
Get AQI alerts for Liverpool
Notify me when air quality reaches:
Free · No account · Unsubscribe any time
Data sources: AQI from ground-level monitoring stations via AQICN. Weather forecast from ECMWF (IFS & CAMS models). AQI calculated using US EPA standard. Updated 2026-06-09T02:23 UTC.