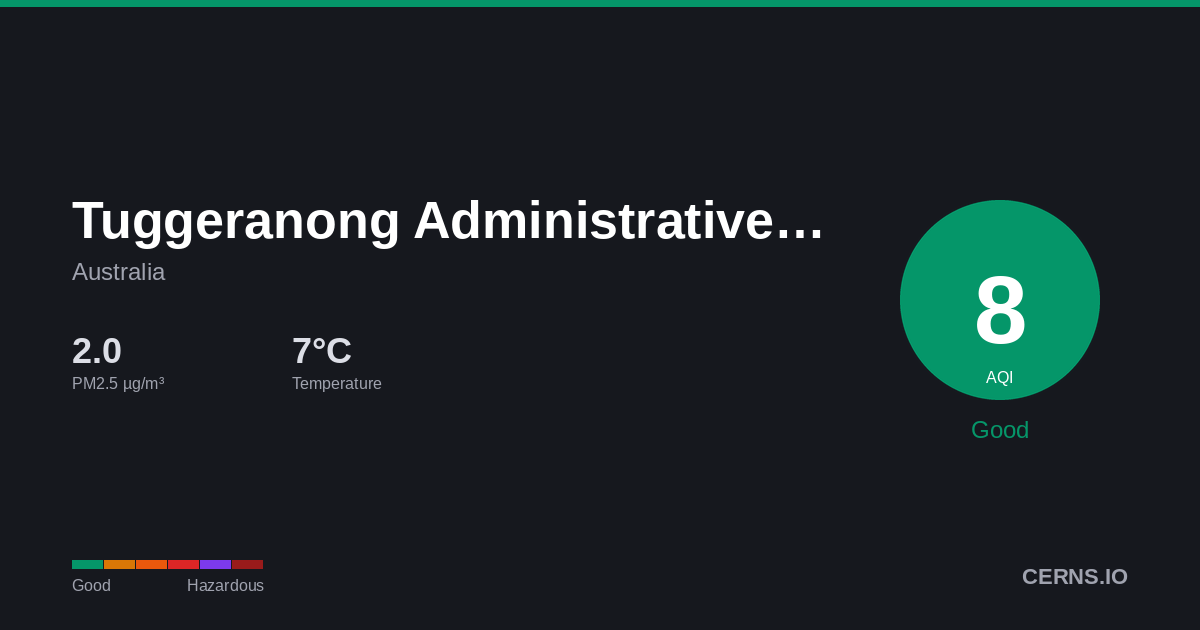
Air Quality in Tuggeranong Administrative District, Australia
Windy
7.1°C · 85.3% humidity
7.1°
Feels 1.5°
8
Good
Air quality is satisfactory. Enjoy outdoor activities.
3 stations
Nearby Monitoring Stations
Tuggeranong Administrative District's air quality — share it
AQI Forecast
Calibrated
66
8am
46
39
8
11am
16
22
26
2pm
28
31
32
5pm
34
35
36
8pm
36
38
38
11pm
39
39
39
2am
39
39
39
5am
39
39
Station readings
45h ago
AQI 38
PM2.5 9.1 µg/m³ · 45h ago
CAMS model
adj +12
54
34
27
25
25
25
25
24
24
24
25
25
25
25
27
27
27
27
27
27
27
27
27
27
Air Quality Index Trend
38h · 3 stnTuggeranong Administrative District's air quality is generally good but can be impacted by bushfire smoke, dust storms, and vehicle emissions. Seasonal fire events can cause significant temporary air quality deterioration.
85.3%
Humidity
51.4 km/h
Wind WNW
1017.2 hPa
Pressure
6.9
UV High
GoodModerateUSGUnhealthyVery UnhealthyHazardous
Which pollutant is driving the AQI?
PM2.5
1.86 µg/m³
PM10▲
13.7 µg/m³
050100150200300500
What is the weather forecast for Tuggeranong Administrative District?
Temperature & Precipitation
PM2.5 Trend
38h · 3 stationsPM2.51.86 µg/m³
✓ WHO
Good
PM1013.7 µg/m³
Good
UV INDEX6.9
High
Station readings (3 stations within 25 km)
1.86
Median
1.27
Average
0.2
Low
1.9
High
PM2.5 µg/m³ · Model: 6.0 · Bias: +4.1
What is the 7-day forecast for Tuggeranong Administrative District?
06-09
7.8° 4.0°
0.31 mm
06-10
10.8° 4.8°
0.69 mm
06-11
8.5° -0.0°
06-12
7.2° 4.8°
2.0 mm
06-13
8.4° 3.2°
06-14
12.3° 9.4°
0.56 mm
06-15
10.0° 4.9°
0.69 mm
Both models agree
Avg diff: 3.9°C
Where are air quality stations near Tuggeranong Administrative District?
60
Monash, Canberra
2
Monash, Canberra
93
Monash, Canberra
63
Monash, Canberra
85
Monash, Canberra
40
Lambert Park, Karabar
53
Civic, Canberra
97
Civic, Canberra
65
Civic, Canberra
81
Civic, Canberra
What cities are near Tuggeranong Administrative District?
Get AQI alerts for Tuggeranong Administrative District
Notify me when air quality reaches:
Free · No account · Unsubscribe any time
Data sources: AQI from ground-level monitoring stations via AQICN. Weather forecast from ECMWF (IFS & CAMS models). AQI calculated using US EPA standard. Updated 2026-06-09T01:07 UTC.