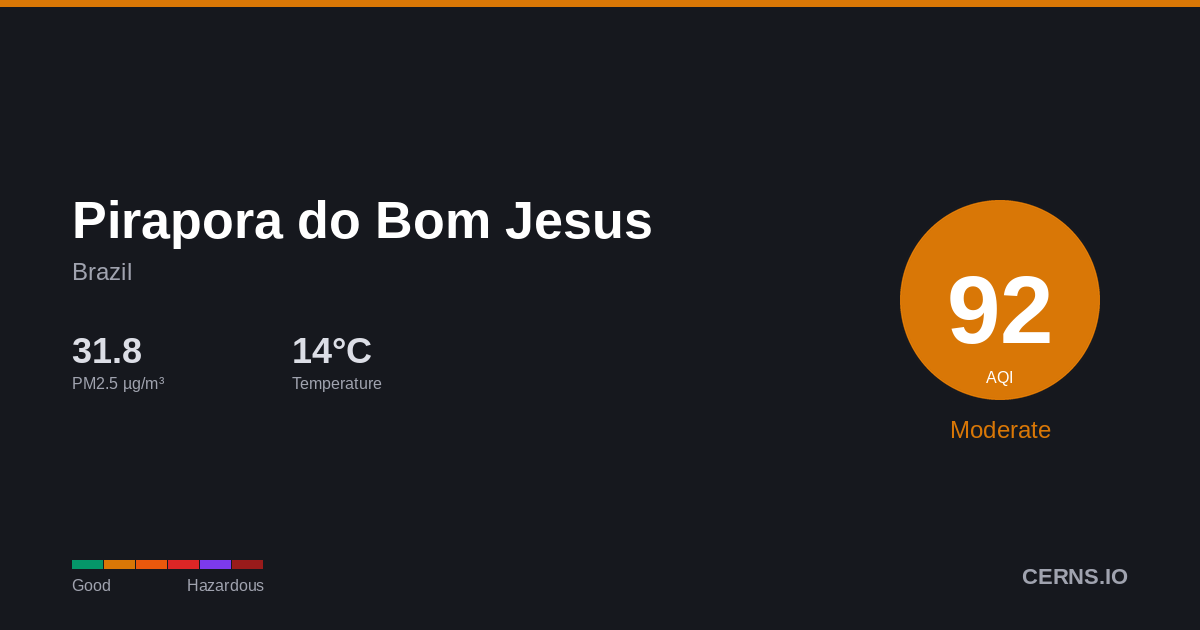
Air Quality in Pirapora do Bom Jesus, Brazil
Windy
13.7°C · 76.8% humidity
13.7°
Feels 13.7°
89
Moderate
Unusually sensitive people should consider reducing prolonged outdoor exertion.
2 stations
Nearby Monitoring Stations
Pirapora do Bom Jesus's air quality — share it
AQI Forecast
54
4am
54
54
89
7am
79
72
67
10am
63
61
59
1pm
57
56
56
4pm
55
55
55
7pm
54
54
54
10pm
54
54
54
1am
54
54
Air Quality Index Trend
48h · 3 stnPirapora do Bom Jesus's air quality is influenced by vehicle emissions, industrial activity, and seasonal agricultural burning. Pollution patterns vary with dry and wet seasons. Current PM2.5 concentration in Pirapora do Bom Jesus is 2.0× the WHO 24-hour guideline of 15 µg/m³.
76.8%
Humidity
48.8 km/h
Wind SE
1023.8 hPa
Pressure
0.7
UV Low
GoodModerateUSGUnhealthyVery UnhealthyHazardous
Which pollutant is driving the AQI?
PM2.5▲
30.31 µg/m³
PM10
41.15 µg/m³
050100150200300500
What is the weather forecast for Pirapora do Bom Jesus?
Temperature & Precipitation
PM2.5 Trend
48h · 3 stationsPM2.530.31 µg/m³
×2.0 WHO
Moderate
PM1041.15 µg/m³
Good
UV INDEX0.7
Low
Station readings (2 stations within 25 km)
30.31
Median
29.7
Average
23.5
Low
35.9
High
PM2.5 µg/m³ · Model: 13.5 · Bias: -16.8
What is the 7-day forecast for Pirapora do Bom Jesus?
06-09
22.7° 13.0°
06-10
17.2° 11.7°
0.13 mm
06-11
17.8° 11.7°
3.37 mm
06-12
19.4° 13.5°
2.69 mm
06-13
23.2° 12.0°
16.38 mm
06-14
25.2° 15.3°
6.44 mm
06-15
17.8° 11.6°
3.69 mm
Both models agree
Avg diff: 2.8°C
Where are air quality stations near Pirapora do Bom Jesus?
168
Carapicuíba, São Paulo, Brazil
85
Carapicuíba, São Paulo, Brazil
30
Pico do Jaraguá, São Paulo, Brazil
107
Jundiaí, São Paulo, Brazil
17
Osasco, São Paulo, Brazil
106
Osasco, São Paulo, Brazil
64
Taboão da Serra, São Paulo, Brazil
28
Taboão da Serra, São Paulo, Brazil
What cities are near Pirapora do Bom Jesus?
Get AQI alerts for Pirapora do Bom Jesus
Notify me when air quality reaches:
Free · No account · Unsubscribe any time
Data sources: AQI from ground-level monitoring stations via AQICN. Weather forecast from ECMWF (IFS & CAMS models). AQI calculated using US EPA standard. Updated 2026-06-09T10:36 UTC.