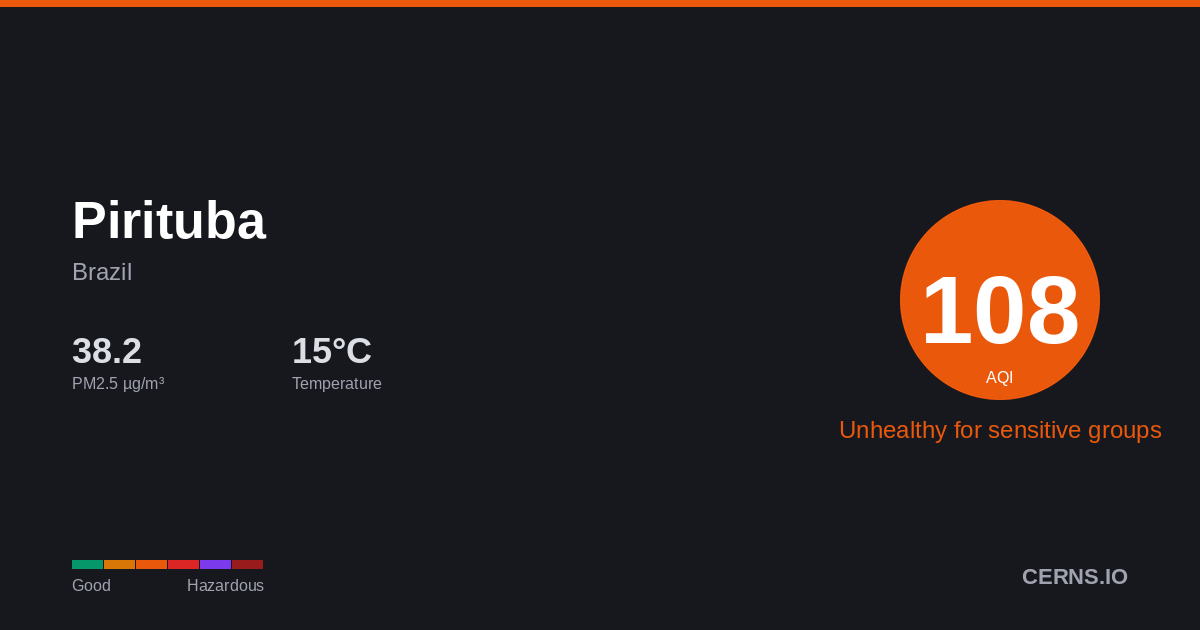
Air Quality in Pirituba, Brazil
Cloudy
15.1°C · 77.7% humidity
15.1°
Feels 15.1°
136
Unhealthy for sensitive groups
Sensitive groups should reduce prolonged outdoor exertion.
28 stations
Nearby Monitoring Stations
Pirituba's air quality — share it
AQI Forecast
Calibrated
104
11pm
119
120
136
2am
123
97
78
5am
73
70
67
8am
65
64
63
11am
43
42
62
2pm
62
61
61
5pm
61
61
61
8pm
61
61
Station readings
104
119
120
CAMS model
adj +7
84
84
84
83
83
66
54
54
54
54
54
54
54
34
34
54
54
54
54
54
54
54
54
54
Air Quality Index Trend
47h · 3 stnPirituba's air quality is influenced by vehicle emissions, industrial activity, and seasonal agricultural burning. Pollution patterns vary with dry and wet seasons. Current PM2.5 concentration in Pirituba is 3.3× the WHO 24-hour guideline of 15 µg/m³.
77.7%
Humidity
38.0 km/h
Wind SE
1021.7 hPa
Pressure
0.7
UV Low
GoodModerateUSGUnhealthyVery UnhealthyHazardous
Which pollutant is driving the AQI?
PM2.5▲
49.92 µg/m³
PM10
79.9 µg/m³
050100150200300500
What is the weather forecast for Pirituba?
Temperature & Precipitation
PM2.5 Trend
47h · 3 stationsPM2.549.92 µg/m³
×3.3 WHO
Unhealthy for sensitive groups
PM1079.9 µg/m³
Moderate
UV INDEX0.7
Low
Station readings (28 stations within 25 km)
49.92
Median
43.28
Average
7.2
Low
67.1
High
PM2.5 µg/m³ · Model: 23.6 · Bias: -26.3
What is the 7-day forecast for Pirituba?
06-09
24.1° 13.4°
06-10
16.5° 13.5°
0.31 mm
06-11
19.1° 12.7°
1.63 mm
06-12
20.3° 14.4°
2.06 mm
06-13
23.1° 13.4°
6.56 mm
06-14
24.0° 16.2°
5.5 mm
06-15
19.3° 12.5°
4.13 mm
Both models agree
Avg diff: 3.1°C
Where are air quality stations near Pirituba?
11
Marg.Tietê-Ponte dos Remédios, São Paulo, Brazil
30
Pico do Jaraguá, São Paulo, Brazil
140
Rio Dos Campos
17
Osasco, São Paulo, Brazil
78
Osasco, São Paulo, Brazil
62
brazil-butantã-avenida-da-universidade
59
Cid.Universitária-USP-Ipen, São Paulo, Brazil
12
Perus, São Paulo, Brazil
77
Cerqueira César, São Paulo, Brazil
154
Estação Vila Polopoli
What cities are near Pirituba?
Get AQI alerts for Pirituba
Notify me when air quality reaches:
Free · No account · Unsubscribe any time
Data sources: AQI from ground-level monitoring stations via AQICN. Weather forecast from ECMWF (IFS & CAMS models). AQI calculated using US EPA standard. Updated 2026-06-09T05:01 UTC.