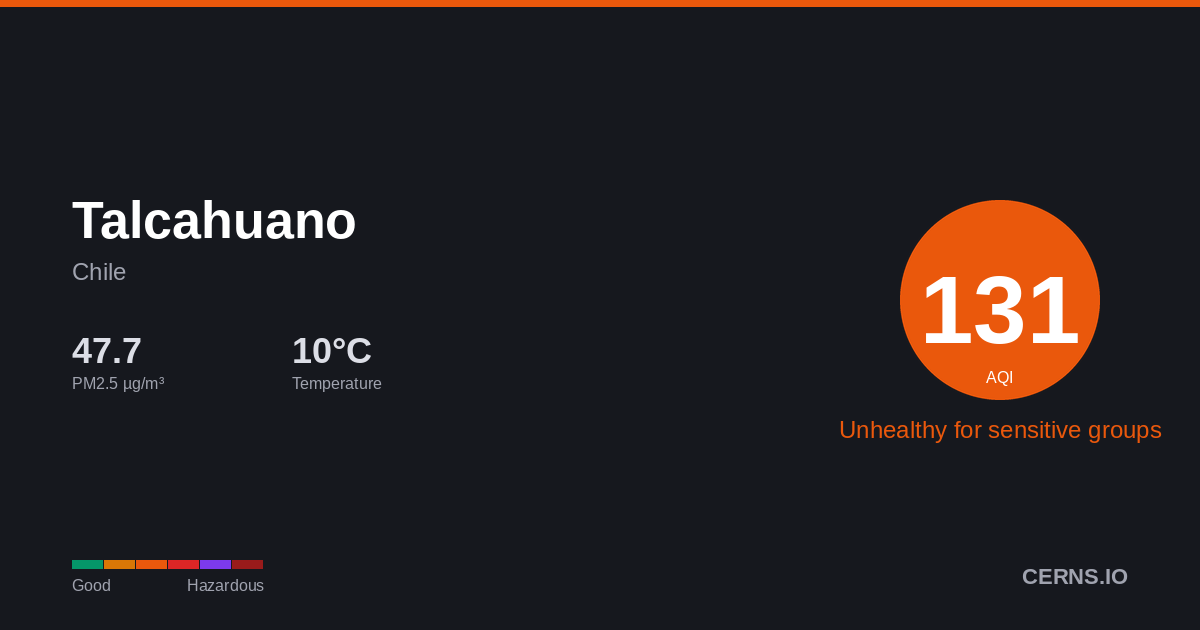
Air Quality in Talcahuano, Chile
Cloudy
10.9°C · 77.3% humidity
10.9°
Feels 10.9°
131
Unhealthy for sensitive groups
Sensitive groups should reduce prolonged outdoor exertion.
4 stations
Nearby Monitoring Stations
Talcahuano's air quality — share it
AQI Forecast
54
7pm
34
54
131
10pm
109
94
82
1am
74
49
44
4am
41
39
31
7am
30
36
28
10am
28
28
28
1pm
25
27
27
4pm
27
27
Air Quality Index Trend
47h · 1 stnTalcahuano's air quality is influenced by vehicle emissions, industrial activity, and seasonal agricultural burning. Pollution patterns vary with dry and wet seasons. Current PM2.5 concentration in Talcahuano is 3.2× the WHO 24-hour guideline of 15 µg/m³.
77.3%
Humidity
32.6 km/h
Wind SSE
1019.9 hPa
Pressure
0.7
UV Low
GoodModerateUSGUnhealthyVery UnhealthyHazardous
Which pollutant is driving the AQI?
PM2.5▲
47.71 µg/m³
PM10
20.55 µg/m³
050100150200300500
What is the weather forecast for Talcahuano?
Temperature & Precipitation
PM2.5 Trend
47h · 1 stationPM2.547.71 µg/m³
×3.2 WHO
Unhealthy for sensitive groups
PM1020.55 µg/m³
Good
UV INDEX0.7
Low
Station readings (4 stations within 25 km)
47.71
Median
36.1
Average
4.1
Low
55.5
High
PM2.5 µg/m³ · Model: 10.0 · Bias: -37.7
What is the 7-day forecast for Talcahuano?
06-09
11.2° 9.7°
06-10
13.3° 9.8°
0.13 mm
06-11
12.3° 9.3°
3.13 mm
06-12
12.2° 9.4°
6.06 mm
06-13
10.5° 5.9°
2.31 mm
06-14
12.4° 6.6°
06-15
13.1° 10.1°
4.06 mm
Both models agree
Avg diff: 1.8°C
Where are air quality stations near Talcahuano?
81
Consultorio - San Vicente, Chile
19
Nueva Libertad, Chile
57
Nueva Libertad, Chile
12
Inpesca, Chile
17
Inpesca, Chile
48
JUNJI, Chile
95
JUNJI, Chile
159
Bocatoma, Chile
97
Bocatoma, Chile
74
Kingston College, Chile
What cities are near Talcahuano?
Get AQI alerts for Talcahuano
Notify me when air quality reaches:
Free · No account · Unsubscribe any time
Data sources: AQI from ground-level monitoring stations via AQICN. Weather forecast from ECMWF (IFS & CAMS models). AQI calculated using US EPA standard. Updated 2026-06-09T02:20 UTC.