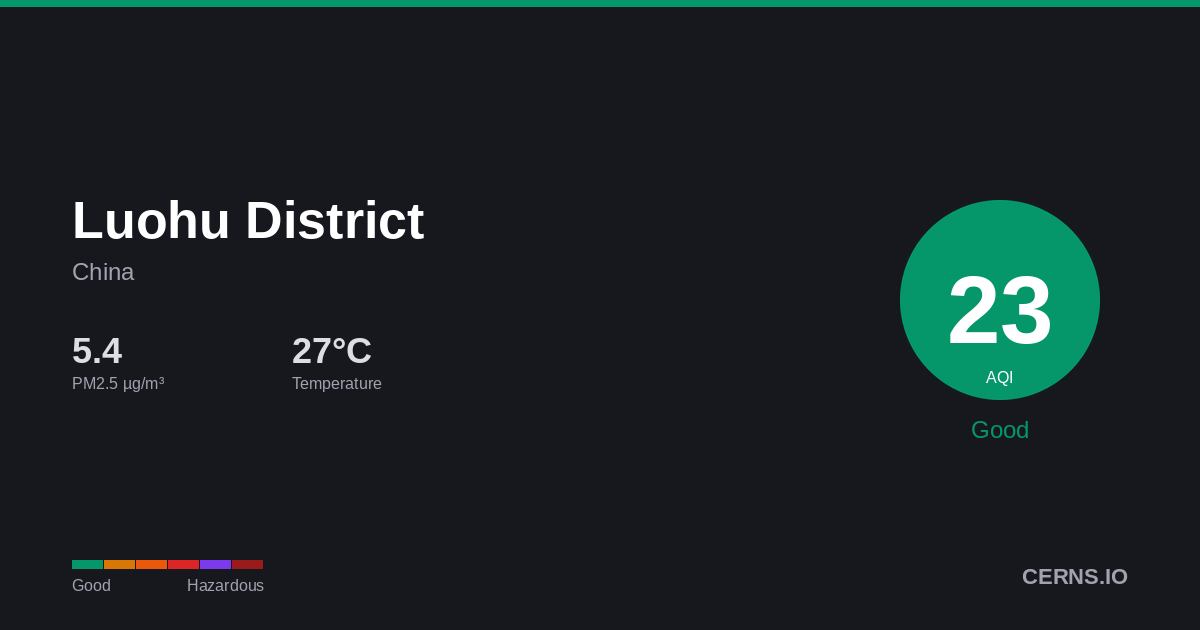
Air Quality in Luohu District, China
Cloudy
23.7°C · 82.2% humidity
23.7°
Feels 23.7°
30
Good
Air quality is satisfactory. Enjoy outdoor activities.
63 stations
Nearby Monitoring Stations
Luohu District's air quality — share it
AQI Forecast
Calibrated
25
1am
5
5
30
4am
18
13
14
7am
32
30
28
10am
27
27
26
1pm
26
26
25
4pm
25
25
37
7pm
37
37
37
10pm
37
37
Station readings
23
36
43
CAMS model
adj -29
54
34
34
34
27
27
34
54
54
54
54
54
54
54
54
54
54
54
66
66
66
66
66
66
Air Quality Index Trend
23h · 1 stnLuohu District's air quality is influenced by industrial emissions, vehicle traffic, and regional pollution transport. Winter heating season and spring dust events typically create the most challenging air quality conditions.
82.2%
Humidity
29.7 km/h
Wind E
1006.7 hPa
Pressure
0.7
UV Low
GoodModerateUSGUnhealthyVery UnhealthyHazardous
Which pollutant is driving the AQI?
PM2.5▲
7.35 µg/m³
PM10
27.45 µg/m³
050100150200300500
What is the weather forecast for Luohu District?
Temperature & Precipitation
PM2.5 Trend
23h · 1 stationPM2.57.35 µg/m³
✓ WHO
Good
PM1027.45 µg/m³
Good
UV INDEX0.7
Low
Station readings (63 stations within 25 km)
7.35
Median
9.31
Average
1.2
Low
92.3
High
PM2.5 µg/m³ · Model: 13.7 · Bias: +6.3
What is the 7-day forecast for Luohu District?
06-08
30.8° 23.7°
7.37 mm
06-09
31.6° 25.4°
2.31 mm
06-10
26.0° 24.4°
0.44 mm
06-11
28.6° 23.7°
1.56 mm
06-12
27.8° 25.6°
6.0 mm
06-13
30.0° 25.4°
24.87 mm
06-14
27.5° 25.2°
5.44 mm
Both models agree
Avg diff: 1.3°C
Where are air quality stations near Luohu District?
53
东门子站, Shenzhen (罗湖区 东门街道)
50
Nanhu, Shenzhen (罗湖区 南湖街道)
32
Nanhu, Shenzhen (罗湖区 南湖街道)
55
Honghu, Shenzhen (罗湖区 笋岗街道)
30
Honghu, Shenzhen (罗湖区 笋岗街道)
13
Honghu, Shenzhen (罗湖区 笋岗街道)
46
Honghu, Shenzhen (罗湖区 笋岗街道)
13
Honghu, Shenzhen (罗湖区 笋岗街道)
70
园岭子站, Shenzhen (福田区 园岭街道)
17
园岭子站, Shenzhen (福田区 园岭街道)
What cities are near Luohu District?
Get AQI alerts for Luohu District
Notify me when air quality reaches:
Free · No account · Unsubscribe any time
Data sources: AQI from ground-level monitoring stations via AQICN. Weather forecast from ECMWF (IFS & CAMS models). AQI calculated using US EPA standard. Updated 2026-06-08T20:44 UTC.