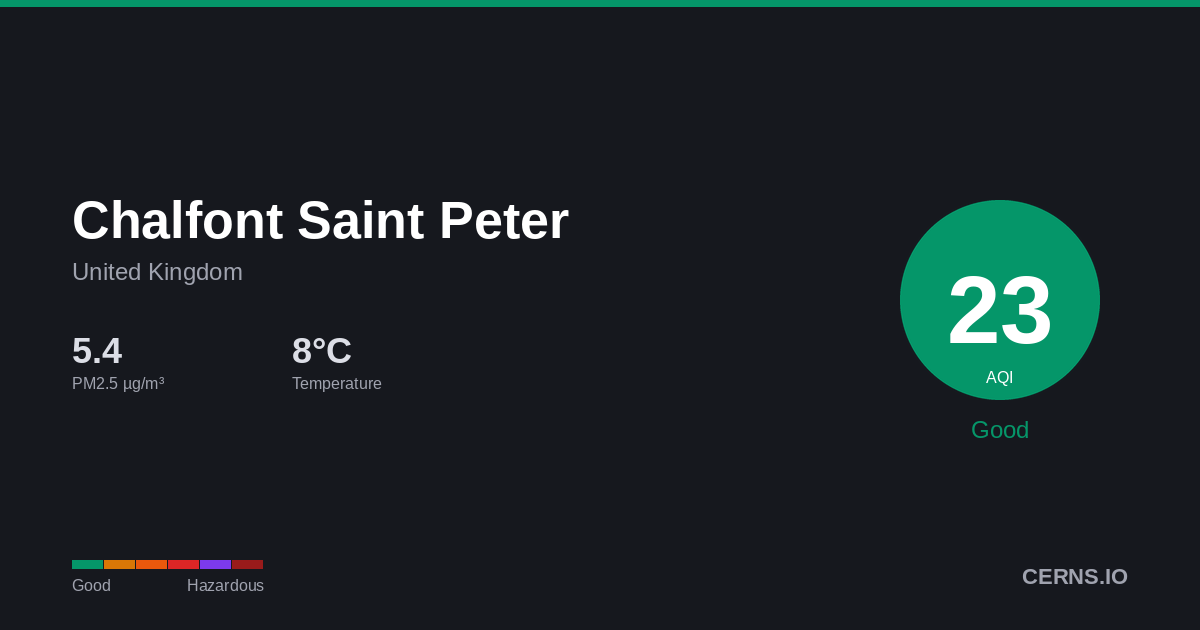
Air Quality in Chalfont Saint Peter, United Kingdom
Cloudy
9.9°C · 81.6% humidity
9.9°
Feels 6.2°
45
Good
Air quality is satisfactory. Enjoy outdoor activities.
9 stations
Nearby Monitoring Stations
Chalfont Saint Peter's air quality — share it
AQI Forecast
Calibrated
3
1am
4
4
45
4am
33
25
19
7am
15
12
10
10am
8
7
6
1pm
5
5
5
4pm
5
4
4
7pm
4
4
4
10pm
4
4
Station readings
13h ago
AQI 4
PM2.5 1.0 µg/m³ · 13h ago
CAMS model
adj -21
24
25
25
25
25
25
25
25
25
25
25
25
25
25
25
25
25
25
25
25
25
25
25
25
Air Quality Index Trend
11h · 1 stnChalfont Saint Peter's air quality is shaped by traffic emissions and residential heating. Pollution levels tend to peak during winter months when cold air traps emissions close to ground level.
81.6%
Humidity
34.1 km/h
Wind WSW
1022.0 hPa
Pressure
0.7
UV Low
GoodModerateUSGUnhealthyVery UnhealthyHazardous
Which pollutant is driving the AQI?
PM2.5▲
10.75 µg/m³
PM10
13.7 µg/m³
050100150200300500
What is the weather forecast for Chalfont Saint Peter?
Temperature & Precipitation
PM2.5 Trend
11h · 1 stationPM2.510.75 µg/m³
✓ WHO
Good
PM1013.7 µg/m³
Good
UV INDEX0.7
Low
Station readings (9 stations within 25 km)
10.75
Median
7.23
Average
0.5
Low
30.2
High
PM2.5 µg/m³ · Model: 5.9 · Bias: -4.8
What is the 7-day forecast for Chalfont Saint Peter?
06-09
17.5° 7.7°
0.31 mm
06-10
13.3° 12.2°
7.5 mm
06-11
26.7° 13.9°
2.19 mm
06-12
22.1° 9.6°
06-13
22.3° 10.1°
0.06 mm
06-14
21.9° 10.5°
0.88 mm
06-15
16.4° 9.1°
4.13 mm
Both models agree
Avg diff: 4.1°C
Where are air quality stations near Chalfont Saint Peter?
7
London Hillingdon Harmondsworth Os, United Kingdom
–
Great Missenden
35
London Harlington, United Kingdom
113
London Harlington, United Kingdom
26
Hounslow Brentford, United Kingdom
25
Hounslow Brentford, United Kingdom
42
Nelson Primary School
16
High St, Witton
61
Chase Bridge Primary School
22
Harlesden HP1
What cities are near Chalfont Saint Peter?
Get AQI alerts for Chalfont Saint Peter
Notify me when air quality reaches:
Free · No account · Unsubscribe any time
Data sources: AQI from ground-level monitoring stations via AQICN. Weather forecast from ECMWF (IFS & CAMS models). AQI calculated using US EPA standard. Updated 2026-06-09T03:15 UTC.