Air Quality in Badūria, India
Windy
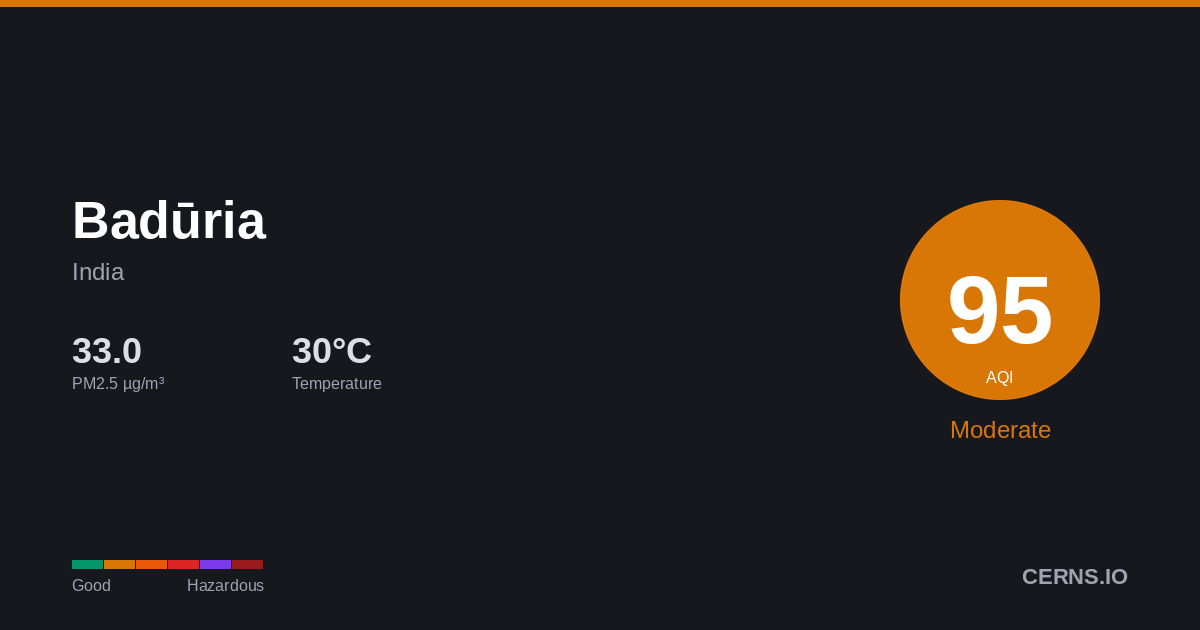
30.0°C · 82.0% humidity
30.0°
Feels 37.5°
95
Moderate
Unusually sensitive people should consider reducing prolonged outdoor exertion.
6 stations
Nearby Monitoring Stations
Badūria's air quality — share it
AQI Forecast
Calibrated
119
11pm
102
102
95
2am
97
98
99
5am
117
118
118
8am
118
119
119
11am
119
120
120
2pm
120
119
119
5pm
120
119
119
8pm
102
102
Station readings
24h ago
AQI 102
PM2.5 36.1 µg/m³ · 24h ago
Air Quality Index Trend
47h · 112 stnBadūria's air quality is affected by vehicle emissions, industrial activity, and seasonal crop burning. Air quality typically worsens from November to February due to temperature inversions trapping pollutants near the surface. Current PM2.5 concentration in Badūria is 2.2× the WHO 24-hour guideline of 15 µg/m³.
82.0%
Humidity
69.2 km/h
Wind SSE
995.4 hPa
Pressure
0.7
UV Low
GoodModerateUSGUnhealthyVery UnhealthyHazardous
Which pollutant is driving the AQI?
PM2.5▲
33.2 µg/m³
PM10
48.05 µg/m³
050100150200300500
What is the weather forecast for Badūria?
Temperature & Precipitation
PM2.5 Trend
47h · 112 stationsPM2.533.2 µg/m³
×2.2 WHO
Moderate
PM1048.05 µg/m³
Good
UV INDEX0.7
Low
Station readings (6 stations within 25 km)
33.2
Median
33.15
Average
23.51
Low
39.03
High
PM2.5 µg/m³ · Model: 23.15 · Bias: -10.1
What is the 7-day forecast for Badūria?
06-08
32.7° 29.4°
1.94 mm
06-09
38.6° 28.7°
1.63 mm
06-10
39.2° 29.4°
0.5 mm
06-11
29.2° 26.1°
10.87 mm
06-12
40.9° 25.7°
4.13 mm
06-13
41.9° 27.0°
9.06 mm
06-14
39.9° 26.6°
11.38 mm
Both models agree
Avg diff: 3.3°C
Where are air quality stations near Badūria?
96
Baduria Municipality
75
Basirhat College
99
Gobardanga College
91
Habra College
109
Ashoknagar-Kalyangarh Municipality
96
Shasan Gram Panchayat
105
Taki Municipality
147
Duttapukur-II G.P.
114
Polerhat Police Station
What cities are near Badūria?
Get AQI alerts for Badūria
Notify me when air quality reaches:
Free · No account · Unsubscribe any time
Data sources: AQI from ground-level monitoring stations via AQICN. Weather forecast from ECMWF (IFS & CAMS models). AQI calculated using US EPA standard. Updated 2026-06-08T21:58 UTC.