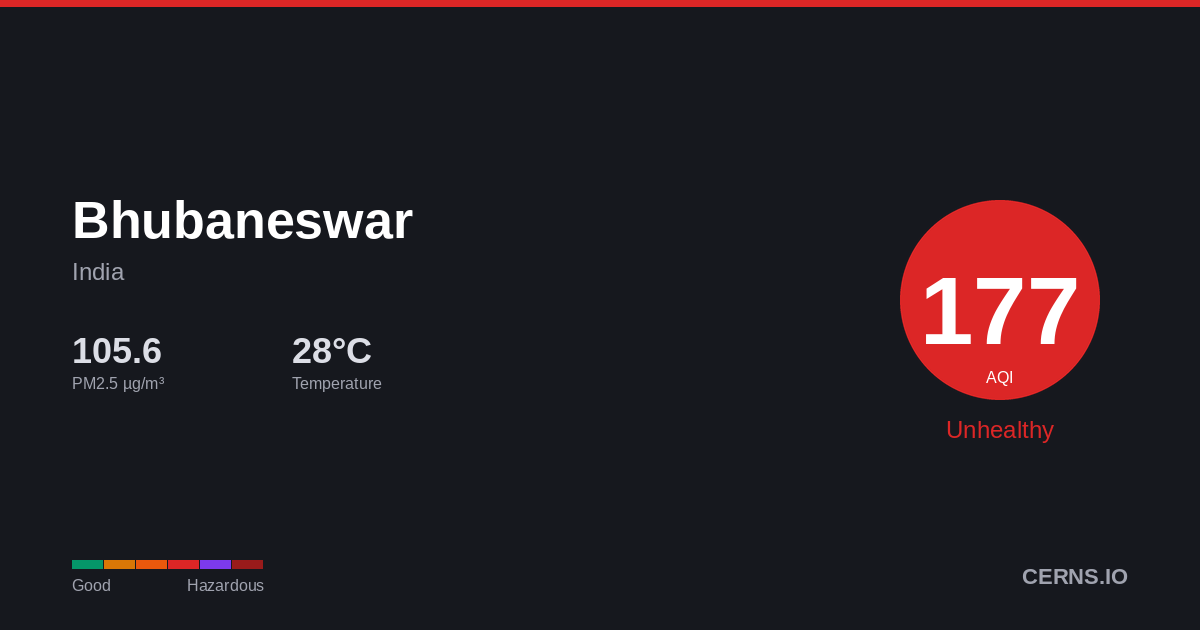
Air Quality in Bhubaneswar, India
Rain
27.5°C · 81.4% humidity
27.5°
Feels 33.3°
256
Very unhealthy
Everyone should avoid outdoor exertion.
3 stations
Nearby Monitoring Stations
Bhubaneswar's air quality — share it
AQI Forecast
Calibrated
82
9pm
82
82
256
12am
202
163
135
3am
115
118
91
6am
84
78
75
9am
72
87
85
12pm
85
84
83
3pm
83
83
82
6pm
82
82
Station readings
22h ago
AQI 65
PM2.5 18.8 µg/m³ · 22h ago
Air Quality Index Trend
35h · 3 stnBhubaneswar's air quality is affected by vehicle emissions, industrial activity, and seasonal crop burning. Air quality typically worsens from November to February due to temperature inversions trapping pollutants near the surface. Current PM2.5 concentration in Bhubaneswar is 13.8× the WHO 24-hour guideline of 15 µg/m³.
81.4%
Humidity
85.3 km/h
Wind WNW
998.4 hPa
Pressure
0.7
UV Low
GoodModerateUSGUnhealthyVery UnhealthyHazardous
Which pollutant is driving the AQI?
PM2.5▲
206.39 µg/m³
PM10
73.05 µg/m³
050100150200300500
What is the weather forecast for Bhubaneswar?
Temperature & Precipitation
PM2.5 Trend
35h · 3 stationsPM2.5206.39 µg/m³
×13.8 WHO
Very unhealthy
PM1073.05 µg/m³
Moderate
UV INDEX0.7
Low
Station readings (3 stations within 25 km)
206.39
Median
93.67
Average
18.0
Low
243.0
High
PM2.5 µg/m³ · Model: 23.6 · Bias: -182.8
What is the 7-day forecast for Bhubaneswar?
06-08
30.0° 26.8°
17.87 mm
06-09
41.9° 29.6°
0.25 mm
06-10
36.8° 29.3°
7.69 mm
06-11
34.6° 26.4°
6.0 mm
06-12
38.6° 26.2°
2.19 mm
06-13
42.9° 26.2°
11.12 mm
06-14
39.7° 27.7°
0.5 mm
Both models agree
Avg diff: 3.7°C
Where are air quality stations near Bhubaneswar?
What cities are near Bhubaneswar?
Get AQI alerts for Bhubaneswar
Notify me when air quality reaches:
Free · No account · Unsubscribe any time
Data sources: AQI from ground-level monitoring stations via AQICN. Weather forecast from ECMWF (IFS & CAMS models). AQI calculated using US EPA standard. Updated 2026-06-08T19:33 UTC.