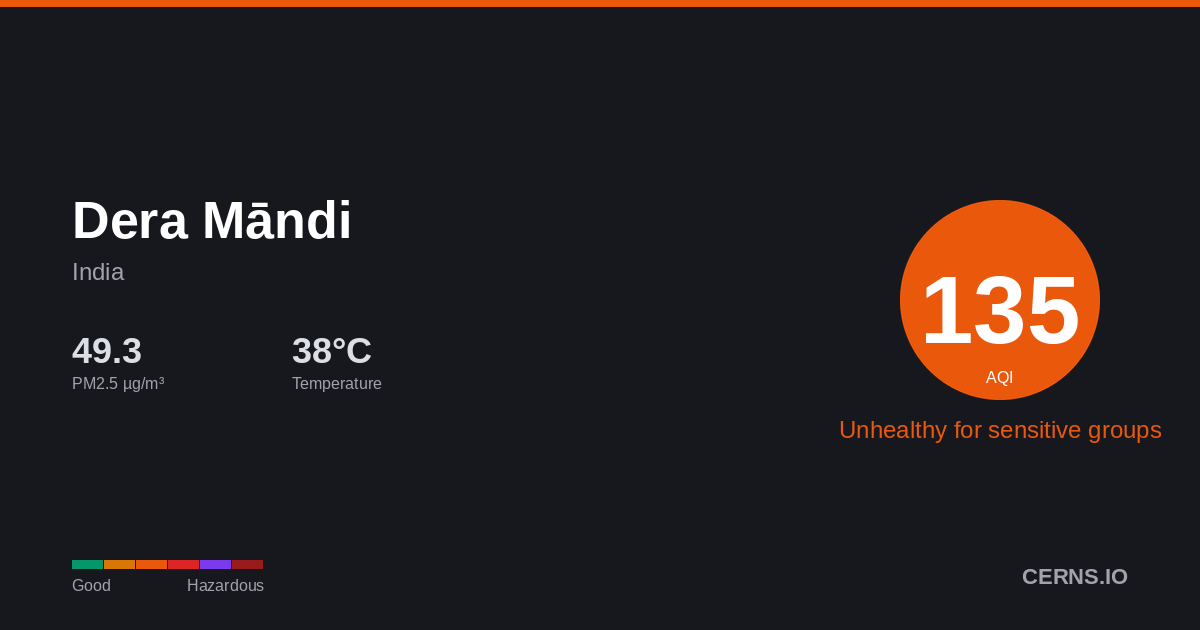
Air Quality in Dera Māndi, India
Windy
37.6°C · 30.1% humidity
37.6°
Feels 37.6°
128
Unhealthy for sensitive groups
Sensitive groups should reduce prolonged outdoor exertion.
39 stations
Nearby Monitoring Stations
Dera Māndi's air quality — share it
AQI Forecast
Calibrated
105
2am
105
105
128
5am
126
150
149
8am
148
148
147
11am
134
134
133
2pm
120
133
120
5pm
133
133
133
8pm
133
133
133
11pm
133
133
Station readings
101
CAMS model
adj -41
146
146
146
161
161
187
187
187
187
187
174
174
174
161
174
161
174
174
174
174
174
174
174
174
Air Quality Index Trend
12h · 1 stnDera Māndi's air quality is affected by vehicle emissions, industrial activity, and seasonal crop burning. Air quality typically worsens from November to February due to temperature inversions trapping pollutants near the surface. Current PM2.5 concentration in Dera Māndi is 3.1× the WHO 24-hour guideline of 15 µg/m³.
30.1%
Humidity
63.0 km/h
Wind W
993.0 hPa
Pressure
0.7
UV Low
GoodModerateUSGUnhealthyVery UnhealthyHazardous
Which pollutant is driving the AQI?
PM2.5
46.5 µg/m³
PM10▲
379.9 µg/m³
050100150200300500
What is the weather forecast for Dera Māndi?
Temperature & Precipitation
PM2.5 Trend
12h · 1 stationPM2.546.5 µg/m³
×3.1 WHO
Unhealthy for sensitive groups
PM10379.9 µg/m³
Very unhealthy
UV INDEX0.7
Low
Station readings (39 stations within 25 km)
46.5
Median
48.33
Average
14.5
Low
191.9
High
PM2.5 µg/m³ · Model: 51.48 · Bias: +5.0
Both models agree
Avg diff: 5.7°C
Where are air quality stations near Dera Māndi?
13
Teri Gram, Gurugram, India
38
Teri Gram, Gurugram, India
27
Teri Gram, Gurugram, India
135
IGNOU_Maidan Garhi, Delhi
58
Aya Nagar, Delhi, Delhi, India
85
Aya Nagar, Delhi, Delhi, India
22
Aya Nagar, Delhi, Delhi, India
44
Aya Nagar, Delhi, Delhi, India
9
Aya Nagar, Delhi, Delhi, India
30
Aya Nagar, Delhi, Delhi, India
What cities are near Dera Māndi?
Get AQI alerts for Dera Māndi
Notify me when air quality reaches:
Free · No account · Unsubscribe any time
Data sources: AQI from ground-level monitoring stations via AQICN. Weather forecast from ECMWF (IFS & CAMS models). AQI calculated using US EPA standard. Updated 2026-06-09T00:50 UTC.