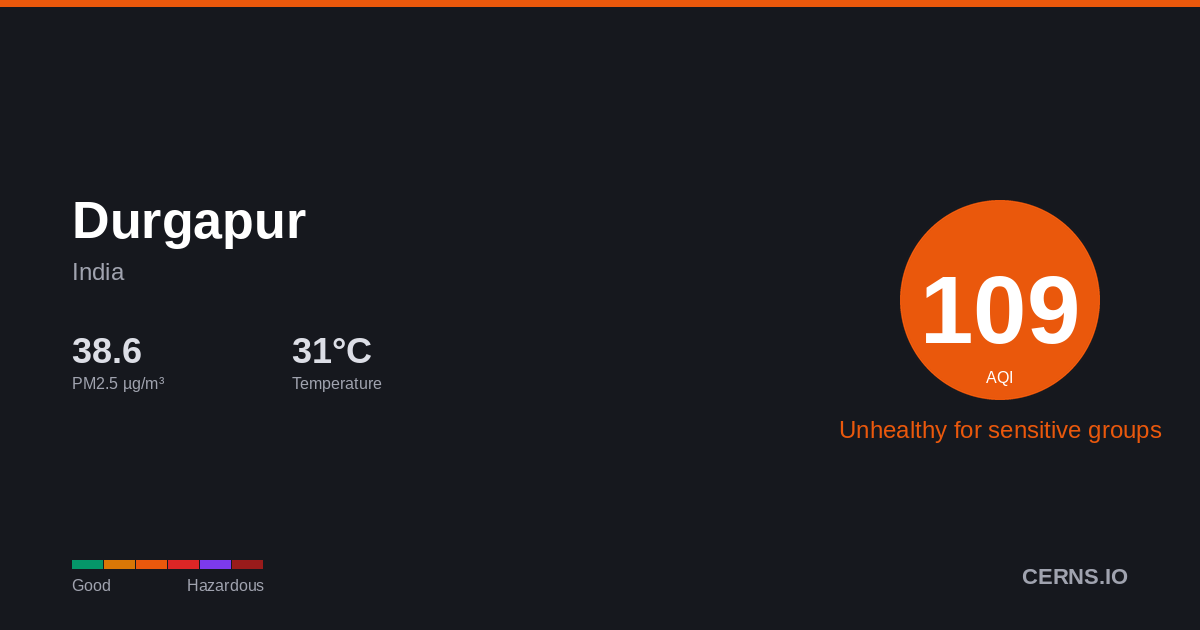
Air Quality in Durgapur, India
Partly Cloudy
30.9°C · 64.5% humidity
30.9°
Feels 36.3°
105
Unhealthy for sensitive groups
Sensitive groups should reduce prolonged outdoor exertion.
16 stations
Nearby Monitoring Stations
Durgapur's air quality — share it
AQI Forecast
Calibrated
119
9pm
119
57
105
12am
91
82
137
3am
132
128
125
6am
124
122
121
9am
121
120
120
12pm
120
119
119
3pm
119
119
134
6pm
134
134
Station readings
22h ago
AQI 119
PM2.5 42.8 µg/m³ · 22h ago
Air Quality Index Trend
48h · 27 stnDurgapur's air quality is affected by vehicle emissions, industrial activity, and seasonal crop burning. Air quality typically worsens from November to February due to temperature inversions trapping pollutants near the surface. Current PM2.5 concentration in Durgapur is 2.5× the WHO 24-hour guideline of 15 µg/m³.
64.5%
Humidity
26.1 km/h
Wind S
996.2 hPa
Pressure
0.7
UV Low
GoodModerateUSGUnhealthyVery UnhealthyHazardous
Which pollutant is driving the AQI?
PM2.5▲
37.24 µg/m³
PM10
104.9 µg/m³
050100150200300500
What is the weather forecast for Durgapur?
Temperature & Precipitation
PM2.5 Trend
48h · 27 stationsPM2.537.24 µg/m³
×2.5 WHO
Unhealthy for sensitive groups
PM10104.9 µg/m³
Moderate
UV INDEX0.7
Low
Station readings (16 stations within 25 km)
37.24
Median
33.21
Average
10.38
Low
58.61
High
PM2.5 µg/m³ · Model: 27.55 · Bias: -9.7
What is the 7-day forecast for Durgapur?
06-08
36.4° 29.5°
2.63 mm
06-09
39.8° 28.8°
0.38 mm
06-10
41.2° 31.4°
4.06 mm
06-11
35.2° 26.2°
10.0 mm
06-12
42.7° 26.8°
14.63 mm
06-13
44.5° 28.7°
1.63 mm
06-14
40.8° 27.2°
3.38 mm
Both models agree
Avg diff: 3.7°C
Where are air quality stations near Durgapur?
130
Durgapur WBPCB Office
11
Sidhu Kanhu Indoor Stadium, Durgapur, India
21
Sidhu Kanhu Indoor Stadium, Durgapur, India
28
Sidhu Kanhu Indoor Stadium, Durgapur, India
18
Sidhu Kanhu Indoor Stadium, Durgapur, India
120
Durgapur Govt. College
123
Sagarbhanga Old BDO Office
130
DMC New Water Treatment Plant
152
Bidhannagar Pump House
94
PCBL Residential Complex, Durgapur
What cities are near Durgapur?
Get AQI alerts for Durgapur
Notify me when air quality reaches:
Free · No account · Unsubscribe any time
Data sources: AQI from ground-level monitoring stations via AQICN. Weather forecast from ECMWF (IFS & CAMS models). AQI calculated using US EPA standard. Updated 2026-06-08T19:33 UTC.