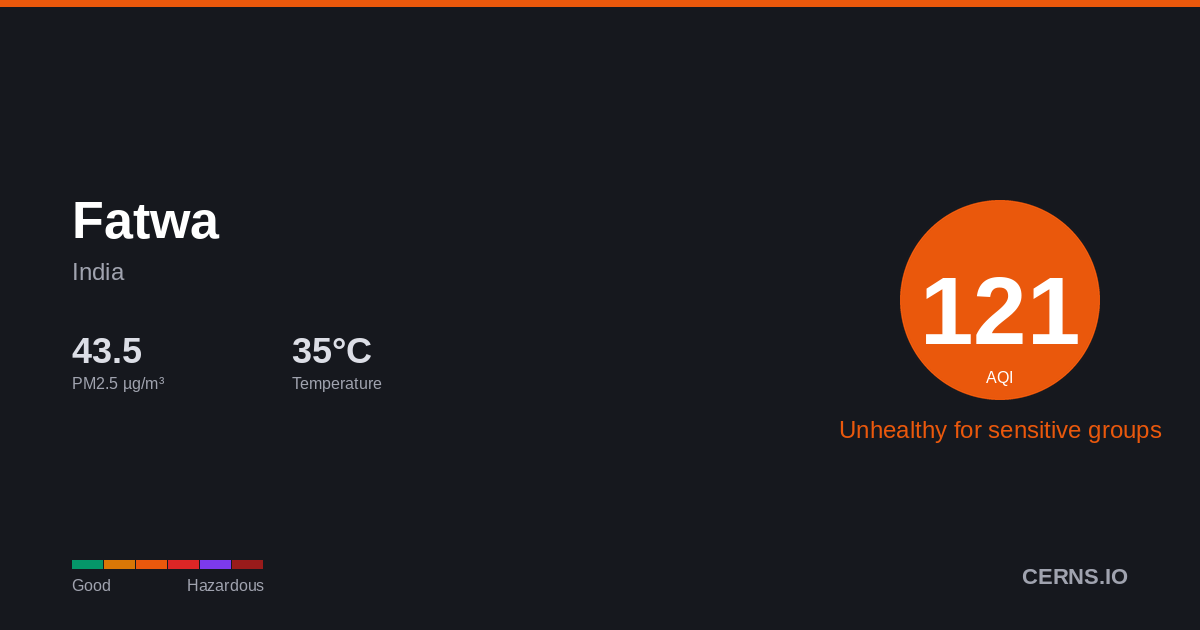
Air Quality in Fatwa, India
Windy
35.4°C · 48.6% humidity
35.4°
Feels 40.7°
88
Moderate
Unusually sensitive people should consider reducing prolonged outdoor exertion.
3 stations
Nearby Monitoring Stations
Fatwa's air quality — share it
AQI Forecast
Calibrated
190
1am
190
190
88
4am
117
138
152
7am
163
171
176
10am
180
183
185
1pm
186
187
188
4pm
189
189
204
7pm
205
205
190
10pm
190
190
Station readings
26h ago
AQI 127
PM2.5 46.1 µg/m³ · 26h ago
Air Quality Index Trend
47h · 3 stnFatwa's air quality is affected by vehicle emissions, industrial activity, and seasonal crop burning. Air quality typically worsens from November to February due to temperature inversions trapping pollutants near the surface. Current PM2.5 concentration in Fatwa is 2.0× the WHO 24-hour guideline of 15 µg/m³.
48.6%
Humidity
57.9 km/h
Wind ENE
993.1 hPa
Pressure
0.7
UV Low
GoodModerateUSGUnhealthyVery UnhealthyHazardous
Which pollutant is driving the AQI?
PM2.5▲
29.6 µg/m³
PM10
129.9 µg/m³
050100150200300500
What is the weather forecast for Fatwa?
Temperature & Precipitation
PM2.5 Trend
47h · 3 stationsPM2.529.6 µg/m³
×2.0 WHO
Moderate
PM10129.9 µg/m³
Moderate
UV INDEX0.7
Low
Station readings (3 stations within 25 km)
29.6
Median
34.03
Average
23.0
Low
43.6
High
PM2.5 µg/m³ · Model: 53.7 · Bias: +24.1
What is the 7-day forecast for Fatwa?
06-08
41.6° 34.4°
2.38 mm
06-09
39.7° 30.2°
0.38 mm
06-10
42.7° 29.8°
2.94 mm
06-11
31.8° 26.8°
3.13 mm
06-12
43.6° 28.0°
0.88 mm
06-13
40.1° 32.0°
0.38 mm
06-14
41.7° 28.5°
0.44 mm
Both models agree
Avg diff: 4.3°C
Where are air quality stations near Fatwa?
30
Govt. High School Shikarpur, Patna, India
15
Govt. High School Shikarpur, Patna, India
30
Govt. High School Shikarpur, Patna, India
4
Govt. High School Shikarpur, Patna, India
34
Govt. High School Shikarpur, Patna, India
99
Govt. High School Shikarpur, Patna, India
18
Govt. High School Shikarpur, Patna, India
50
Govt. High School Shikarpur, Patna, India
25
Muradpur, Patna, India
36
Muradpur, Patna, India
What cities are near Fatwa?
Get AQI alerts for Fatwa
Notify me when air quality reaches:
Free · No account · Unsubscribe any time
Data sources: AQI from ground-level monitoring stations via AQICN. Weather forecast from ECMWF (IFS & CAMS models). AQI calculated using US EPA standard. Updated 2026-06-08T23:19 UTC.