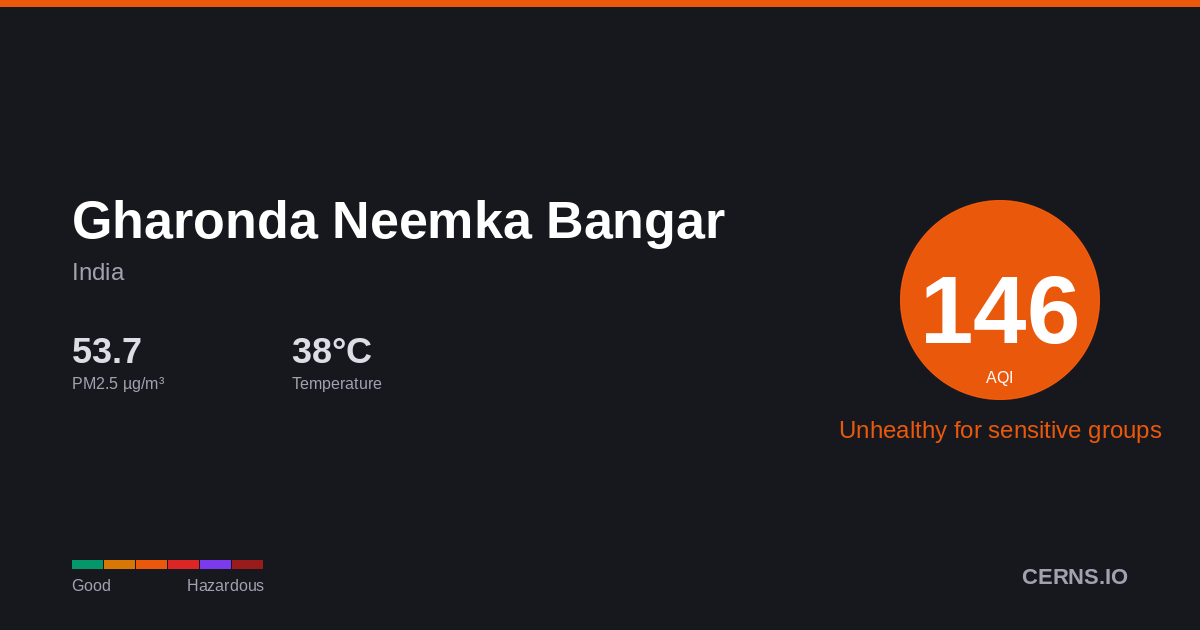
Air Quality in Gharonda Neemka Bangar, India
Rain
31.6°C · 55.9% humidity
31.6°
Feels 36.1°
162
Unhealthy
Everyone should reduce prolonged outdoor exertion.
52 stations
Nearby Monitoring Stations
Gharonda Neemka Bangar's air quality — share it
AQI Forecast
Calibrated
176
8pm
176
176
162
11pm
166
169
171
2am
172
173
174
5am
175
175
175
8am
176
161
161
11am
161
99
99
2pm
99
99
99
5pm
161
161
Station readings
117
CAMS model
adj +15
161
161
161
161
161
161
161
161
161
161
161
161
161
161
146
146
146
84
84
84
84
84
146
146
Air Quality Index Trend
10h · 1 stnGharonda Neemka Bangar's air quality is affected by vehicle emissions, industrial activity, and seasonal crop burning. Air quality typically worsens from November to February due to temperature inversions trapping pollutants near the surface. Current PM2.5 concentration in Gharonda Neemka Bangar is 5.2× the WHO 24-hour guideline of 15 µg/m³.
55.9%
Humidity
120.5 km/h
Wind NNW
995.5 hPa
Pressure
0.7
UV Low
GoodModerateUSGUnhealthyVery UnhealthyHazardous
Which pollutant is driving the AQI?
PM2.5
77.45 µg/m³
PM10▲
404.9 µg/m³
050100150200300500
What is the weather forecast for Gharonda Neemka Bangar?
Temperature & Precipitation
PM2.5 Trend
10h · 1 stationPM2.577.45 µg/m³
×5.2 WHO
Unhealthy
PM10404.9 µg/m³
Very unhealthy
UV INDEX0.7
Low
Station readings (52 stations within 25 km)
77.45
Median
92.3
Average
8.4
Low
440.1
High
PM2.5 µg/m³ · Model: 51.48 · Bias: -26.0
What is the 7-day forecast for Gharonda Neemka Bangar?
06-08
38.9° 31.3°
3.81 mm
06-09
45.5° 38.0°
06-10
44.5° 36.3°
06-11
44.5° 27.1°
1.13 mm
06-12
44.1° 36.9°
06-13
46.0° 31.9°
0.06 mm
06-14
44.3° 36.2°
0.31 mm
Both models agree
Avg diff: 5.6°C
Where are air quality stations near Gharonda Neemka Bangar?
12
Mother Dairy Plant, Parparganj, Delhi, Delhi, India
80
Mother Dairy Plant, Parparganj, Delhi, Delhi, India
155
Patparganj, Delhi
158
Commonwealth Sports Complex, Delhi
12
Sector-1, Noida, India
160
Sector-1, Noida, India
17
Sector-1, Noida, India
11
Sector-1, Noida, India
30
Sector-1, Noida, India
34
Anand Vihar, Delhi, Delhi, India
What cities are near Gharonda Neemka Bangar?
Get AQI alerts for Gharonda Neemka Bangar
Notify me when air quality reaches:
Free · No account · Unsubscribe any time
Data sources: AQI from ground-level monitoring stations via AQICN. Weather forecast from ECMWF (IFS & CAMS models). AQI calculated using US EPA standard. Updated 2026-06-08T18:15 UTC.