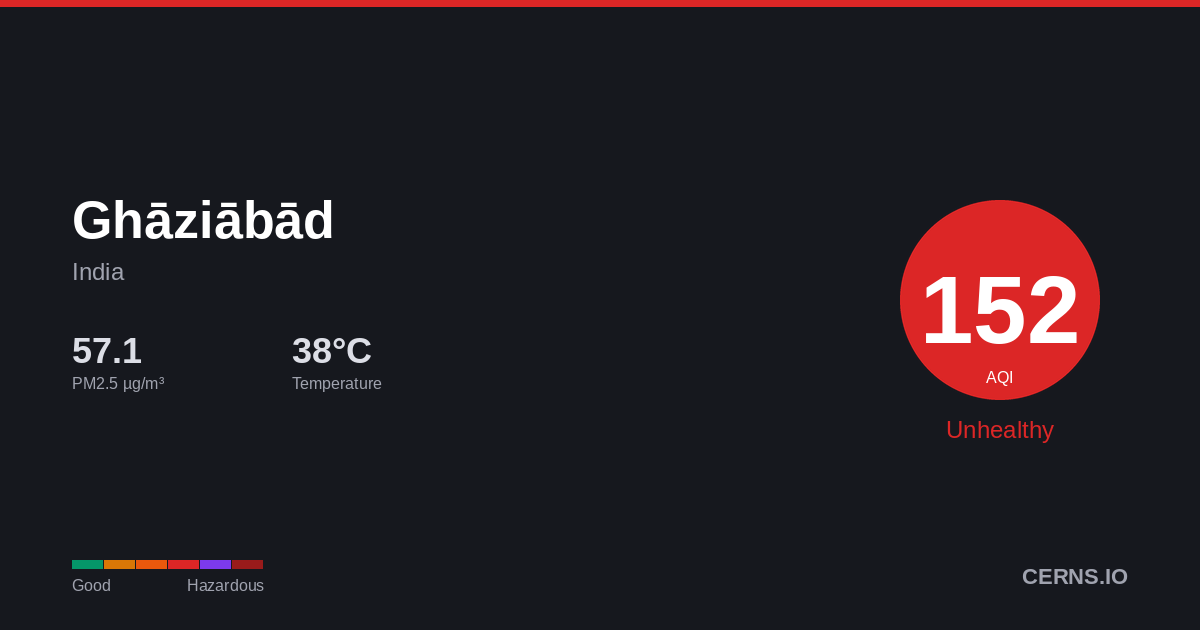
Air Quality in Ghāziābād, India
Drizzle
33.2°C · 46.5% humidity
33.2°
Feels 36.9°
177
Unhealthy
Everyone should reduce prolonged outdoor exertion.
28 stations
Nearby Monitoring Stations
Ghāziābād's air quality — share it
AQI Forecast
Calibrated
190
10pm
190
190
177
1am
181
183
185
4am
187
201
201
7am
202
189
189
10am
190
175
113
1pm
112
112
112
4pm
112
113
175
7pm
175
175
Station readings
23h ago
AQI 113
PM2.5 40.4 µg/m³ · 23h ago
Air Quality Index Trend
48h · 20 stnGhāziābād's air quality is affected by vehicle emissions, industrial activity, and seasonal crop burning. Air quality typically worsens from November to February due to temperature inversions trapping pollutants near the surface. Current PM2.5 concentration in Ghāziābād is 7.0× the WHO 24-hour guideline of 15 µg/m³.
46.5%
Humidity
131.8 km/h
Wind NNW
994.2 hPa
Pressure
0.7
UV Low
GoodModerateUSGUnhealthyVery UnhealthyHazardous
Which pollutant is driving the AQI?
PM2.5
105.01 µg/m³
PM10▲
404.9 µg/m³
050100150200300500
What is the weather forecast for Ghāziābād?
Temperature & Precipitation
PM2.5 Trend
48h · 20 stationsPM2.5105.01 µg/m³
×7.0 WHO
Unhealthy
PM10404.9 µg/m³
Very unhealthy
UV INDEX0.7
Low
Station readings (28 stations within 25 km)
105.01
Median
85.79
Average
24.5
Low
330.9
High
PM2.5 µg/m³ · Model: 64.32 · Bias: -40.7
What is the 7-day forecast for Ghāziābād?
06-08
37.3° 28.6°
0.5 mm
06-09
45.1° 37.6°
06-10
44.5° 36.1°
06-11
41.7° 26.4°
1.19 mm
06-12
44.9° 34.7°
06-13
45.8° 29.9°
06-14
43.5° 33.8°
0.62 mm
Both models agree
Avg diff: 6.0°C
Where are air quality stations near Ghāziābād?
87
Sanjay Nagar, Ghaziabad, India
18
Sanjay Nagar, Ghaziabad, India
20
Sanjay Nagar, Ghaziabad, India
132
Govindpuram, Ghaziabad
11
Vasundhara, Ghaziabad, India
16
Indirapuram, Ghaziabad, India
27
Sector - 62, Noida, India
26
Sector - 62, Noida, India
6
Sector - 62, Noida, India
26
Sector - 62, Noida, India
What cities are near Ghāziābād?
Get AQI alerts for Ghāziābād
Notify me when air quality reaches:
Free · No account · Unsubscribe any time
Data sources: AQI from ground-level monitoring stations via AQICN. Weather forecast from ECMWF (IFS & CAMS models). AQI calculated using US EPA standard. Updated 2026-06-08T20:42 UTC.