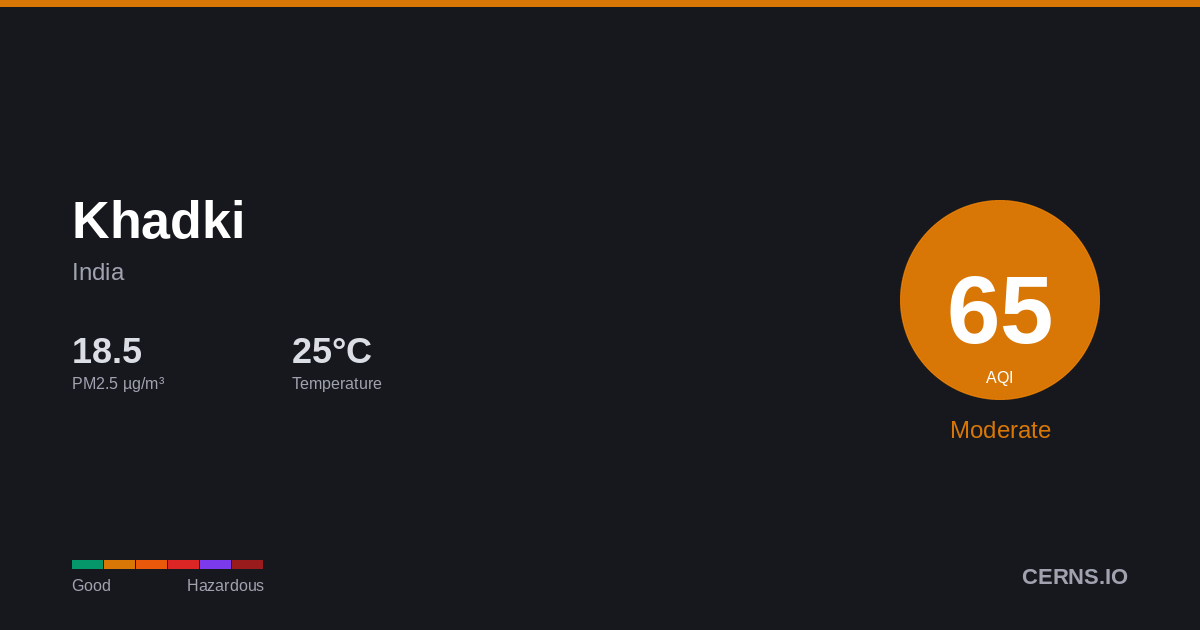
Air Quality in Khadki, India
Rain
24.4°C · 82.8% humidity
24.4°
Feels 24.4°
80
Moderate
Unusually sensitive people should consider reducing prolonged outdoor exertion.
11 stations
Nearby Monitoring Stations
Khadki's air quality — share it
AQI Forecast
Calibrated
33
10pm
33
33
80
1am
66
56
49
4am
44
49
47
7am
65
63
62
10am
62
61
61
1pm
61
60
60
4pm
60
60
60
7pm
60
60
Station readings
23h ago
AQI 60
PM2.5 16.3 µg/m³ · 23h ago
Air Quality Index Trend
36h · 11 stnKhadki's air quality is affected by vehicle emissions, industrial activity, and seasonal crop burning. Air quality typically worsens from November to February due to temperature inversions trapping pollutants near the surface. Current PM2.5 concentration in Khadki is 1.7× the WHO 24-hour guideline of 15 µg/m³.
82.8%
Humidity
78.3 km/h
Wind SW
1003.8 hPa
Pressure
0.7
UV Low
GoodModerateUSGUnhealthyVery UnhealthyHazardous
Which pollutant is driving the AQI?
PM2.5▲
26.04 µg/m³
PM10
13.7 µg/m³
050100150200300500
What is the weather forecast for Khadki?
Temperature & Precipitation
PM2.5 Trend
36h · 11 stationsPM2.526.04 µg/m³
×1.7 WHO
Moderate
PM1013.7 µg/m³
Good
UV INDEX0.7
Low
Station readings (11 stations within 25 km)
26.04
Median
20.76
Average
9.94
Low
34.85
High
PM2.5 µg/m³ · Model: 6.25 · Bias: -19.8
What is the 7-day forecast for Khadki?
06-08
25.7° 24.0°
3.69 mm
06-09
30.5° 25.2°
0.5 mm
06-10
30.2° 23.0°
0.13 mm
06-11
26.2° 23.2°
0.44 mm
06-12
30.6° 24.9°
0.38 mm
06-13
30.9° 24.6°
0.31 mm
06-14
29.4° 23.8°
0.25 mm
Both models agree
Avg diff: 2.4°C
Where are air quality stations near Khadki?
53
Savitribai Phule Pune University, Pune
91
Revenue Colony-Shivajinagar, Pune
77
Panchawati_Pashan, Pune
79
Savta Mali Nagar, Pimpri-Chinchwad
71
Mhada Colony, Pune
50
Park Street Wakad, Pimpri Chinchwad
74
Gavalinagar, Pimpri Chinchwad
74
Thergaon, Pimpri Chinchwad
55
Dhankawadi, Pune
39
Bhumkar Nagar, Pune
What cities are near Khadki?
Get AQI alerts for Khadki
Notify me when air quality reaches:
Free · No account · Unsubscribe any time
Data sources: AQI from ground-level monitoring stations via AQICN. Weather forecast from ECMWF (IFS & CAMS models). AQI calculated using US EPA standard. Updated 2026-06-08T20:42 UTC.