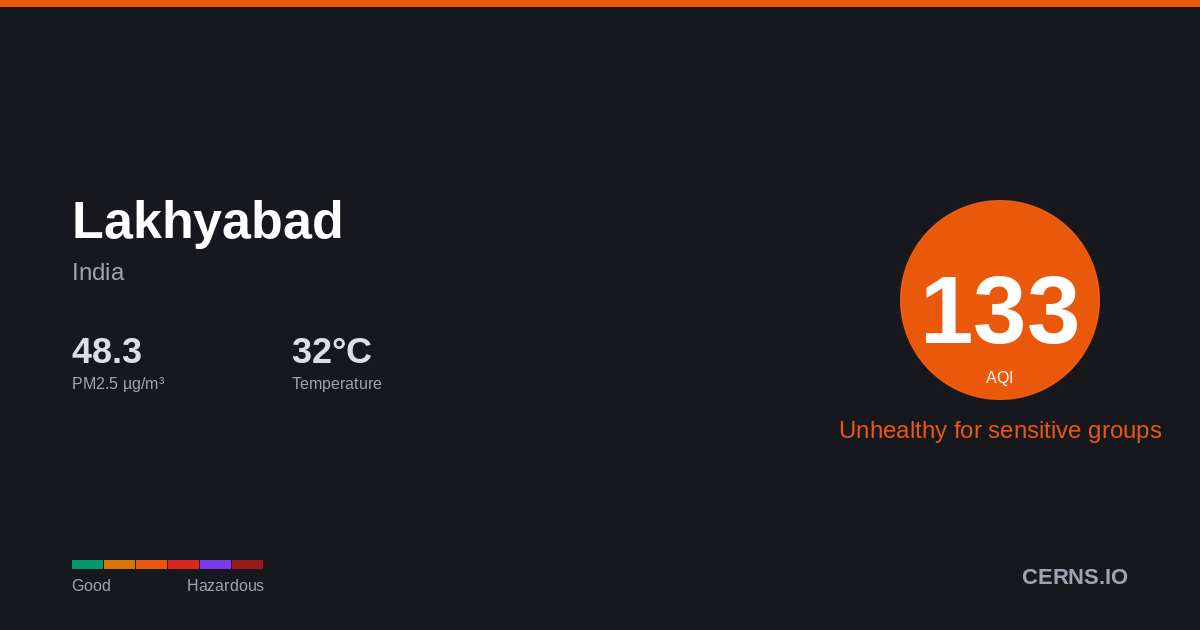
Air Quality in Lakhyabad, India
Drizzle
32.4°C · 58.4% humidity
32.4°
Feels 37.8°
130
Unhealthy for sensitive groups
Sensitive groups should reduce prolonged outdoor exertion.
2 stations
Nearby Monitoring Stations
Lakhyabad's air quality — share it
AQI Forecast
Calibrated
50
1am
50
50
130
4am
125
121
119
7am
117
115
114
10am
114
113
113
1pm
113
112
112
4pm
112
112
112
7pm
127
112
112
10pm
112
112
Station readings
26h ago
AQI 112
PM2.5 39.8 µg/m³ · 26h ago
Air Quality Index Trend
48h · 19 stnLakhyabad's air quality is affected by vehicle emissions, industrial activity, and seasonal crop burning. Air quality typically worsens from November to February due to temperature inversions trapping pollutants near the surface. Current PM2.5 concentration in Lakhyabad is 3.2× the WHO 24-hour guideline of 15 µg/m³.
58.4%
Humidity
38.7 km/h
Wind ESE
994.4 hPa
Pressure
0.7
UV Low
GoodModerateUSGUnhealthyVery UnhealthyHazardous
Which pollutant is driving the AQI?
PM2.5▲
47.36 µg/m³
PM10
104.9 µg/m³
050100150200300500
What is the weather forecast for Lakhyabad?
Temperature & Precipitation
PM2.5 Trend
48h · 19 stationsPM2.547.36 µg/m³
×3.2 WHO
Unhealthy for sensitive groups
PM10104.9 µg/m³
Moderate
UV INDEX0.7
Low
Station readings (2 stations within 25 km)
47.36
Median
47.87
Average
46.61
Low
49.13
High
PM2.5 µg/m³ · Model: 53.7 · Bias: +6.3
What is the 7-day forecast for Lakhyabad?
06-08
36.1° 30.1°
0.63 mm
06-09
40.7° 29.8°
3.75 mm
06-10
39.3° 31.2°
3.5 mm
06-11
31.1° 26.1°
6.63 mm
06-12
43.1° 26.4°
3.13 mm
06-13
45.1° 29.7°
0.94 mm
06-14
41.3° 28.4°
11.69 mm
Both models agree
Avg diff: 4.2°C
Where are air quality stations near Lakhyabad?
112
Raghunathpur College, Raghunathpur
129
Panchakot Mahavidyalaya, Sarberia
136
Dihika Pump House
31
Sardar Patel Nagar, Dhanbad
136
DESHABANDHU MAHAVIDYALAYA, CHITTARANJAN
What cities are near Lakhyabad?
Get AQI alerts for Lakhyabad
Notify me when air quality reaches:
Free · No account · Unsubscribe any time
Data sources: AQI from ground-level monitoring stations via AQICN. Weather forecast from ECMWF (IFS & CAMS models). AQI calculated using US EPA standard. Updated 2026-06-08T23:27 UTC.