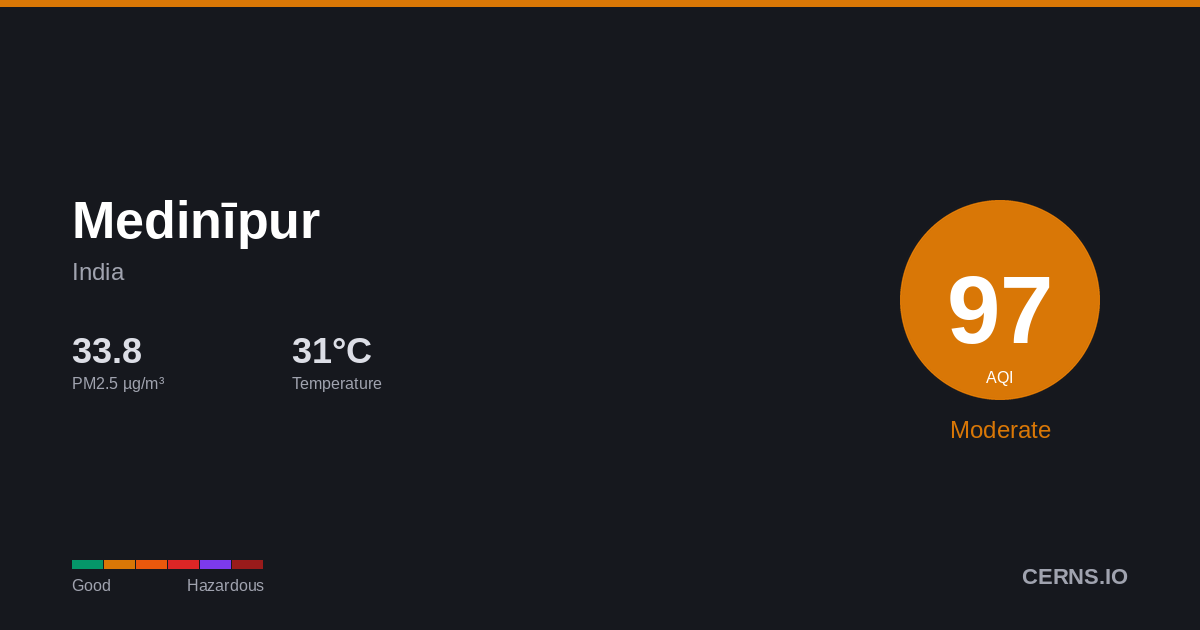
Air Quality in Medinīpur, India
Cloudy
31.3°C · 72.5% humidity
31.3°
Feels 38.3°
99
Moderate
Unusually sensitive people should consider reducing prolonged outdoor exertion.
2 stations
Nearby Monitoring Stations
Medinīpur's air quality — share it
AQI Forecast
Calibrated
113
3am
113
113
99
6am
103
106
108
9am
109
110
111
12pm
112
112
112
3pm
113
175
175
6pm
175
175
175
9pm
175
175
175
12am
175
175
Station readings
28h ago
AQI 95
PM2.5 32.8 µg/m³ · 28h ago
Air Quality Index Trend
47h · 12 stnMedinīpur's air quality is affected by vehicle emissions, industrial activity, and seasonal crop burning. Air quality typically worsens from November to February due to temperature inversions trapping pollutants near the surface. Current PM2.5 concentration in Medinīpur is 2.3× the WHO 24-hour guideline of 15 µg/m³.
72.5%
Humidity
38.4 km/h
Wind ESE
994.5 hPa
Pressure
1.4
UV Low
GoodModerateUSGUnhealthyVery UnhealthyHazardous
Which pollutant is driving the AQI?
PM2.5▲
35.02 µg/m³
PM10
104.9 µg/m³
050100150200300500
What is the weather forecast for Medinīpur?
Temperature & Precipitation
PM2.5 Trend
47h · 12 stationsPM2.535.02 µg/m³
×2.3 WHO
Moderate
PM10104.9 µg/m³
Moderate
UV INDEX1.4
Low
Station readings (2 stations within 25 km)
35.02
Median
28.4
Average
20.88
Low
35.93
High
PM2.5 µg/m³ · Model: 28.0 · Bias: -7.0
What is the 7-day forecast for Medinīpur?
06-09
42.2° 29.7°
2.31 mm
06-10
43.6° 30.7°
0.38 mm
06-11
33.0° 26.7°
22.81 mm
06-12
44.1° 26.7°
9.31 mm
06-13
44.4° 27.4°
9.25 mm
06-14
41.7° 27.4°
1.75 mm
06-15
40.0° 29.0°
0.44 mm
Both models agree
Avg diff: 4.4°C
Where are air quality stations near Medinīpur?
103
Vidyasagar University
70
Hijli Town Office Police Kharagpur
166
Salboni Police Station
84
Sabang Sajanikanta Mahavidyalaya
What cities are near Medinīpur?
Get AQI alerts for Medinīpur
Notify me when air quality reaches:
Free · No account · Unsubscribe any time
Data sources: AQI from ground-level monitoring stations via AQICN. Weather forecast from ECMWF (IFS & CAMS models). AQI calculated using US EPA standard. Updated 2026-06-09T01:05 UTC.