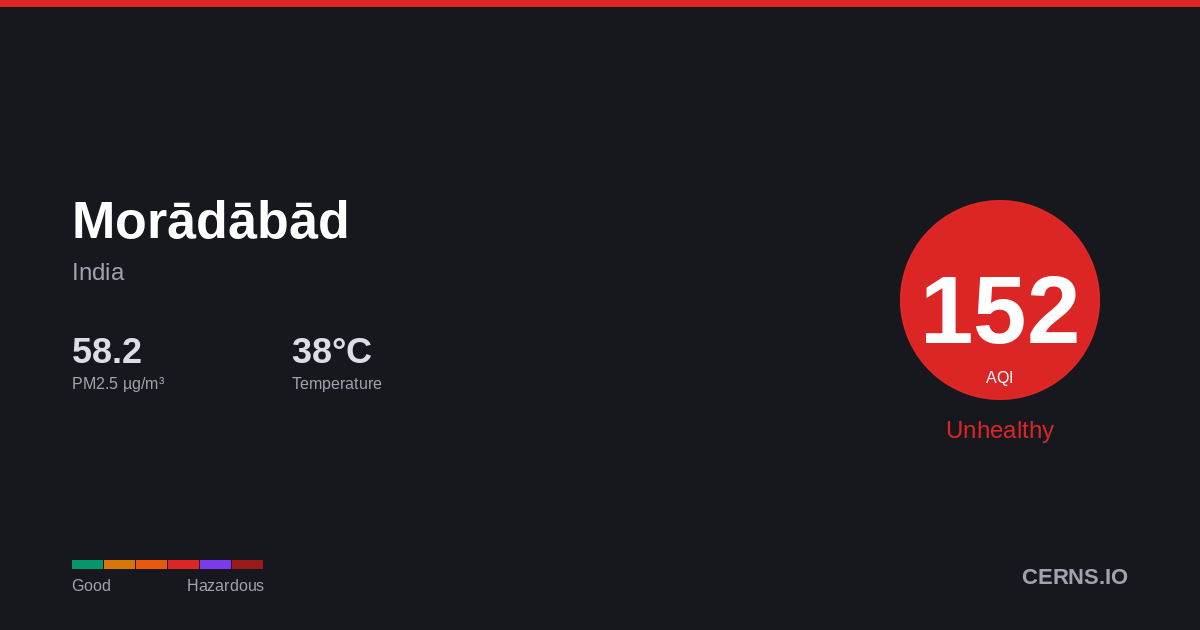
Air Quality in Morādābād, India
Windy
38.1°C · 36.0% humidity
38.1°
Feels 38.1°
113
Unhealthy for sensitive groups
Sensitive groups should reduce prolonged outdoor exertion.
9 stations
Nearby Monitoring Stations
Morādābād's air quality — share it
AQI Forecast
Calibrated
139
9pm
139
154
113
12am
125
133
139
3am
143
146
148
6am
150
136
75
9am
76
138
138
12pm
138
139
139
3pm
77
77
77
6pm
139
139
Station readings
22h ago
AQI 77
PM2.5 24.3 µg/m³ · 22h ago
Air Quality Index Trend
45h · 6 stnMorādābād's air quality is affected by vehicle emissions, industrial activity, and seasonal crop burning. Air quality typically worsens from November to February due to temperature inversions trapping pollutants near the surface. Current PM2.5 concentration in Morādābād is 2.7× the WHO 24-hour guideline of 15 µg/m³.
36.0%
Humidity
71.2 km/h
Wind SW
990.3 hPa
Pressure
0.7
UV Low
GoodModerateUSGUnhealthyVery UnhealthyHazardous
Which pollutant is driving the AQI?
PM2.5▲
40.35 µg/m³
PM10
179.9 µg/m³
050100150200300500
What is the weather forecast for Morādābād?
Temperature & Precipitation
PM2.5 Trend
45h · 6 stationsPM2.540.35 µg/m³
×2.7 WHO
Unhealthy for sensitive groups
PM10179.9 µg/m³
Unhealthy for sensitive groups
UV INDEX0.7
Low
Station readings (9 stations within 25 km)
40.35
Median
52.37
Average
19.7
Low
105.9
High
PM2.5 µg/m³ · Model: 64.32 · Bias: +24.0
What is the 7-day forecast for Morādābād?
06-08
39.6° 30.1°
0.06 mm
06-09
44.9° 34.1°
06-10
45.5° 33.1°
06-11
37.2° 27.2°
6.06 mm
06-12
44.7° 29.8°
0.06 mm
06-13
45.9° 29.5°
0.63 mm
06-14
43.3° 31.3°
0.69 mm
Both models agree
Avg diff: 6.1°C
Where are air quality stations near Morādābād?
6
Jigar Colony, Moradabad, India
29
Jigar Colony, Moradabad, India
18
Jigar Colony, Moradabad, India
38
Kashiram Nagar, Moradabad, India
21
Transport Nagar, Moradabad, India
16
Transport Nagar, Moradabad, India
53
Transport Nagar, Moradabad, India
30
Transport Nagar, Moradabad, India
22
Transport Nagar, Moradabad, India
33
Transport Nagar, Moradabad, India
What cities are near Morādābād?
Get AQI alerts for Morādābād
Notify me when air quality reaches:
Free · No account · Unsubscribe any time
Data sources: AQI from ground-level monitoring stations via AQICN. Weather forecast from ECMWF (IFS & CAMS models). AQI calculated using US EPA standard. Updated 2026-06-08T19:32 UTC.