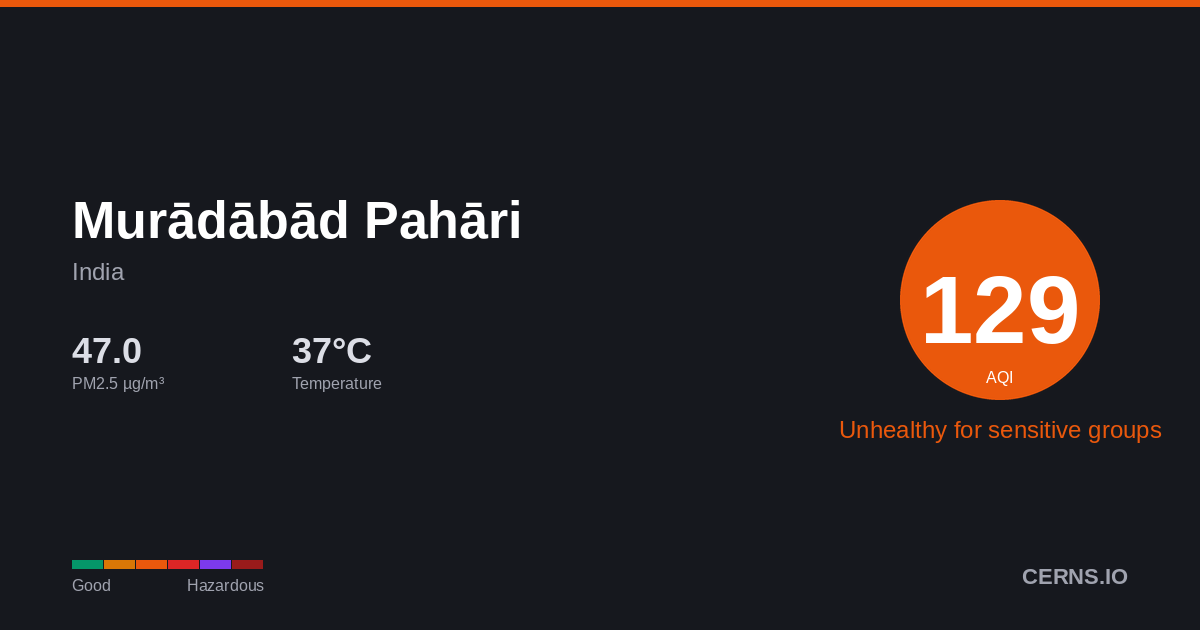
Air Quality in Murādābād Pahāri, India
Drizzle
37.2°C · 37.4% humidity
37.2°
Feels 37.2°
152
Unhealthy
Everyone should reduce prolonged outdoor exertion.
60 stations
Nearby Monitoring Stations
Murādābād Pahāri's air quality — share it
AQI Forecast
161
9pm
161
161
152
12am
155
141
143
3am
144
159
160
6am
186
186
187
9am
187
187
174
12pm
174
174
161
3pm
174
161
174
6pm
174
174
Station readings
117
CAMS model
161
161
161
161
161
146
146
146
161
161
187
187
187
187
187
174
174
174
161
174
161
174
174
174
Air Quality Index Trend
10h · 1 stnMurādābād Pahāri's air quality is affected by vehicle emissions, industrial activity, and seasonal crop burning. Air quality typically worsens from November to February due to temperature inversions trapping pollutants near the surface. Current PM2.5 concentration in Murādābād Pahāri is 3.9× the WHO 24-hour guideline of 15 µg/m³.
37.4%
Humidity
76.9 km/h
Wind NNW
993.4 hPa
Pressure
0.7
UV Low
GoodModerateUSGUnhealthyVery UnhealthyHazardous
Which pollutant is driving the AQI?
PM2.5
58.34 µg/m³
PM10▲
354.9 µg/m³
050100150200300500
What is the weather forecast for Murādābād Pahāri?
Temperature & Precipitation
PM2.5 Trend
10h · 1 stationPM2.558.34 µg/m³
×3.9 WHO
Unhealthy
PM10354.9 µg/m³
Very unhealthy
UV INDEX0.7
Low
Station readings (60 stations within 25 km)
58.34
Median
70.98
Average
4.8
Low
386.1
High
PM2.5 µg/m³ · Model: 51.48 · Bias: -6.9
Both models agree
Avg diff: 5.6°C
Where are air quality stations near Murādābād Pahāri?
91
R.K. Puram, Delhi, Delhi, India
160
R.K. Puram, Delhi, Delhi, India
34
R.K. Puram, Delhi, Delhi, India
42
R.K. Puram, Delhi, Delhi, India
146
JNU, Delhi
105
IGI Airport (T3), Delhi
129
R K Puram, Delhi
155
New Moti Bagh, Delhi
89
Cantonment Area, Delhi
122
IIT Delhi, Delhi
What cities are near Murādābād Pahāri?
Get AQI alerts for Murādābād Pahāri
Notify me when air quality reaches:
Free · No account · Unsubscribe any time
Data sources: AQI from ground-level monitoring stations via AQICN. Weather forecast from ECMWF (IFS & CAMS models). AQI calculated using US EPA standard. Updated 2026-06-08T19:34 UTC.