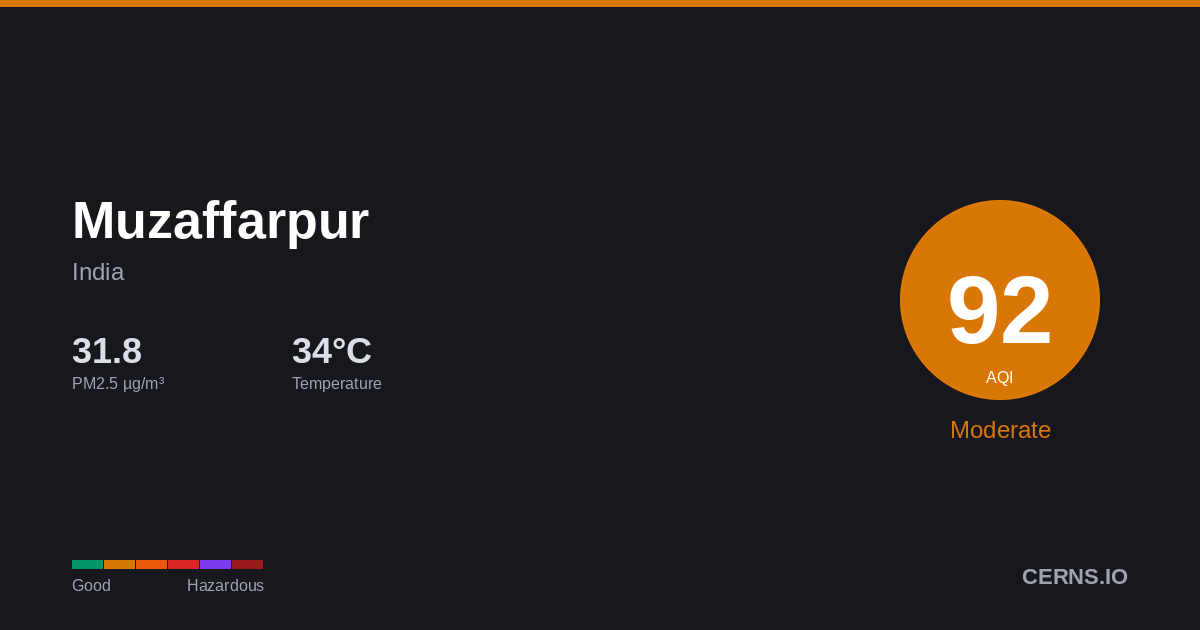
Air Quality in Muzaffarpur, India
Drizzle
34.3°C · 50.1% humidity
34.3°
Feels 39.1°
92
Moderate
Unusually sensitive people should consider reducing prolonged outdoor exertion.
4 stations
Nearby Monitoring Stations
Muzaffarpur's air quality — share it
AQI Forecast
Calibrated
236
9pm
236
236
92
12am
133
162
183
3am
198
147
217
6am
222
226
229
9am
231
232
233
12pm
234
235
235
3pm
235
236
236
6pm
236
236
Station readings
22h ago
AQI 174
PM2.5 100.3 µg/m³ · 22h ago
Air Quality Index Trend
42h · 4 stnMuzaffarpur's air quality is affected by vehicle emissions, industrial activity, and seasonal crop burning. Air quality typically worsens from November to February due to temperature inversions trapping pollutants near the surface. Current PM2.5 concentration in Muzaffarpur is 2.1× the WHO 24-hour guideline of 15 µg/m³.
50.1%
Humidity
52.7 km/h
Wind SSE
994.4 hPa
Pressure
0.7
UV Low
GoodModerateUSGUnhealthyVery UnhealthyHazardous
Which pollutant is driving the AQI?
PM2.5
31.84 µg/m³
PM10▲
179.9 µg/m³
050100150200300500
What is the weather forecast for Muzaffarpur?
Temperature & Precipitation
PM2.5 Trend
42h · 4 stationsPM2.531.84 µg/m³
×2.1 WHO
Moderate
PM10179.9 µg/m³
Unhealthy for sensitive groups
UV INDEX0.7
Low
Station readings (4 stations within 25 km)
31.84
Median
37.8
Average
26.8
Low
46.9
High
PM2.5 µg/m³ · Model: 64.32 · Bias: +32.5
What is the 7-day forecast for Muzaffarpur?
06-08
41.1° 32.7°
1.19 mm
06-09
38.5° 28.0°
06-10
40.0° 27.9°
4.0 mm
06-11
32.1° 26.4°
7.88 mm
06-12
40.0° 27.9°
1.25 mm
06-13
39.2° 30.0°
0.38 mm
06-14
40.4° 27.1°
Both models agree
Avg diff: 3.2°C
Where are air quality stations near Muzaffarpur?
16
Buddha Colony, Muzaffarpur, India
32
Buddha Colony, Muzaffarpur, India
21
Buddha Colony, Muzaffarpur, India
40
Buddha Colony, Muzaffarpur, India
158
Buddha Colony, Muzaffarpur, India
25
Buddha Colony, Muzaffarpur, India
78
Muzaffarpur Collectorate, Muzaffarpur, India
15
Muzaffarpur Collectorate, Muzaffarpur, India
18
Muzaffarpur Collectorate, Muzaffarpur, India
What cities are near Muzaffarpur?
Get AQI alerts for Muzaffarpur
Notify me when air quality reaches:
Free · No account · Unsubscribe any time
Data sources: AQI from ground-level monitoring stations via AQICN. Weather forecast from ECMWF (IFS & CAMS models). AQI calculated using US EPA standard. Updated 2026-06-08T19:32 UTC.