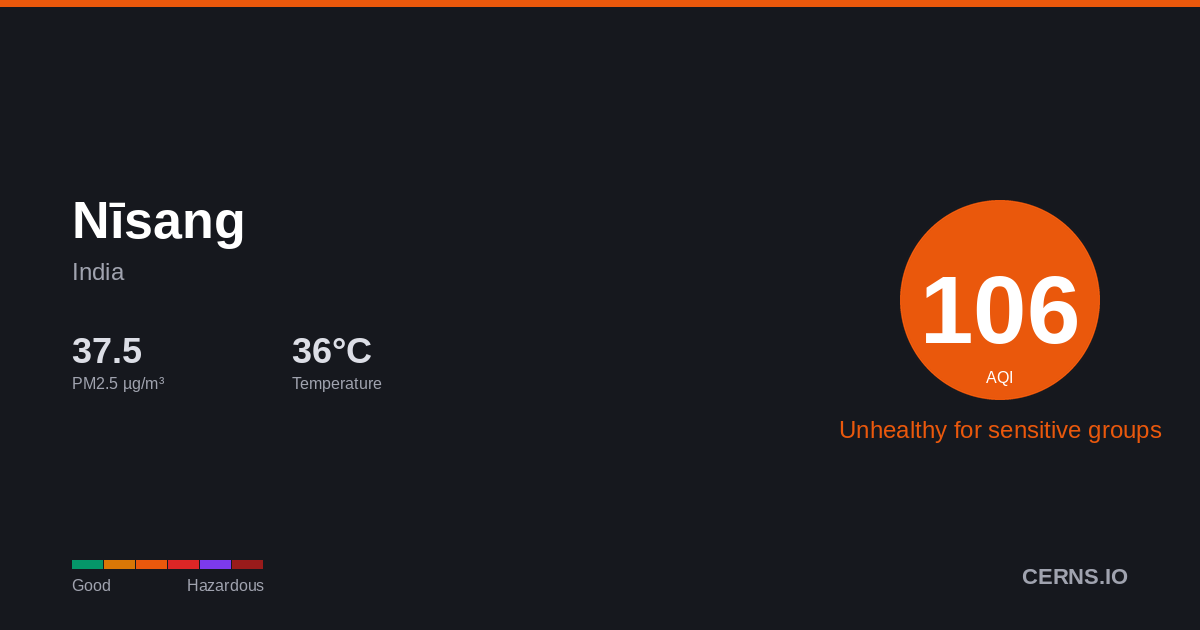
Air Quality in Nīsang, India
Clear
36.1°C · 31.3% humidity
36.1°
Feels 36.1°
147
Unhealthy for sensitive groups
Sensitive groups should reduce prolonged outdoor exertion.
Calibrated model
Nearby Monitoring Stations
Nīsang's air quality — share it
AQI Forecast
Calibrated
320
4am
320
333
147
7am
196
216
241
10am
259
272
282
1pm
303
308
324
4pm
327
329
330
7pm
331
331
332
10pm
332
319
320
1am
305
320
Station readings
29h ago
AQI 333
PM2.5 291.2 µg/m³ · 29h ago
Air Quality Index Trend
47h · 3 stnNīsang's air quality is affected by vehicle emissions, industrial activity, and seasonal crop burning. Air quality typically worsens from November to February due to temperature inversions trapping pollutants near the surface. Current PM2.5 concentration in Nīsang is 3.6× the WHO 24-hour guideline of 15 µg/m³.
31.3%
Humidity
38.6 km/h
Wind W
993.2 hPa
Pressure
4.4
UV Moderate
GoodModerateUSGUnhealthyVery UnhealthyHazardous
Which pollutant is driving the AQI?
PM2.5
53.97 µg/m³
PM10▲
272.4 µg/m³
050100150200300500
What is the weather forecast for Nīsang?
Temperature & Precipitation
PM2.5 Trend
47h · 3 stationsPM2.553.97 µg/m³
×3.6 WHO
Unhealthy for sensitive groups
PM10272.4 µg/m³
Unhealthy
UV INDEX4.4
Moderate
What is the 7-day forecast for Nīsang?
06-09
45.3° 36.1°
06-10
45.0° 35.0°
0.06 mm
06-11
44.5° 27.5°
7.25 mm
06-12
45.1° 33.4°
0.13 mm
06-13
46.1° 29.8°
06-14
46.0° 35.4°
0.44 mm
06-15
46.3° 35.5°
Both models agree
Avg diff: 6.3°C
Where are air quality stations near Nīsang?
31
Sector-12, Karnal, India
103
Sector-12, Karnal, India
17
Sector-12, Karnal, India
30
Sector-18, Panipat, India
43
Sector-18, Panipat, India
6
Sector-18, Panipat, India
77
Sector-18, Panipat, India
What cities are near Nīsang?
Get AQI alerts for Nīsang
Notify me when air quality reaches:
Free · No account · Unsubscribe any time
Data sources: AQI from ground-level monitoring stations via AQICN. Weather forecast from ECMWF (IFS & CAMS models). AQI calculated using US EPA standard. Updated 2026-06-09T02:21 UTC.