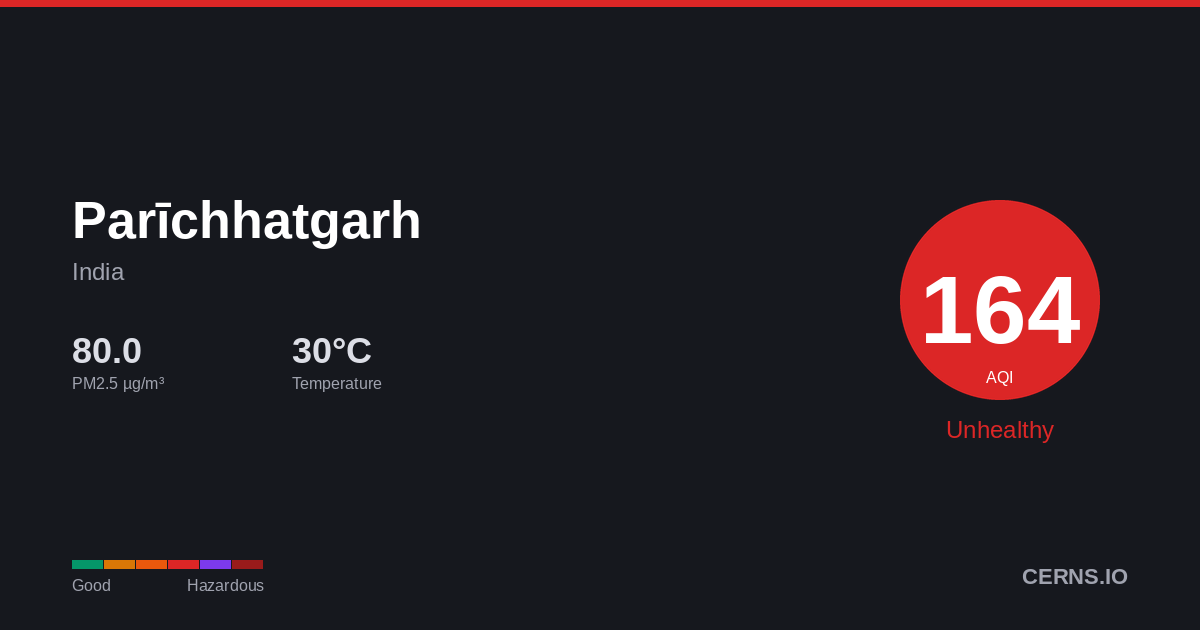
Air Quality in Parīchhatgarh, India
Drizzle
30.4°C · 55.2% humidity
30.4°
Feels 34.2°
144
Unhealthy for sensitive groups
Sensitive groups should reduce prolonged outdoor exertion.
3 stations
Nearby Monitoring Stations
Parīchhatgarh's air quality — share it
AQI Forecast
Calibrated
165
8pm
165
180
144
11pm
154
162
167
2am
171
173
188
5am
190
190
178
8am
179
179
179
11am
180
165
165
2pm
102
102
102
5pm
103
103
Station readings
21h ago
AQI 103
PM2.5 36.5 µg/m³ · 21h ago
Air Quality Index Trend
47h · 7 stnParīchhatgarh's air quality is affected by vehicle emissions, industrial activity, and seasonal crop burning. Air quality typically worsens from November to February due to temperature inversions trapping pollutants near the surface. Current PM2.5 concentration in Parīchhatgarh is 3.5× the WHO 24-hour guideline of 15 µg/m³.
55.2%
Humidity
119.6 km/h
Wind NW
993.4 hPa
Pressure
0.7
UV Low
GoodModerateUSGUnhealthyVery UnhealthyHazardous
Which pollutant is driving the AQI?
PM2.5
52.77 µg/m³
PM10▲
289.9 µg/m³
050100150200300500
What is the weather forecast for Parīchhatgarh?
Temperature & Precipitation
PM2.5 Trend
47h · 7 stationsPM2.552.77 µg/m³
×3.5 WHO
Unhealthy for sensitive groups
PM10289.9 µg/m³
Unhealthy
UV INDEX0.7
Low
Station readings (3 stations within 25 km)
52.77
Median
52.53
Average
40.0
Low
76.8
High
PM2.5 µg/m³ · Model: 64.32 · Bias: +11.6
What is the 7-day forecast for Parīchhatgarh?
06-08
39.3° 26.7°
0.56 mm
06-09
44.3° 35.4°
0.13 mm
06-10
44.7° 35.6°
06-11
39.0° 26.3°
7.31 mm
06-12
46.0° 30.9°
0.06 mm
06-13
46.7° 29.2°
06-14
43.9° 33.2°
0.31 mm
Both models agree
Avg diff: 6.2°C
Where are air quality stations near Parīchhatgarh?
–
Jai Bhim Nagar, Meerut, India
9
Jai Bhim Nagar, Meerut, India
19
Jai Bhim Nagar, Meerut, India
89
Ganga Nagar, Meerut, India
61
Ganga Nagar, Meerut, India
16
Pallavpuram Phase 2, Meerut, India
18
Pallavpuram Phase 2, Meerut, India
3
Pallavpuram Phase 2, Meerut, India
What cities are near Parīchhatgarh?
Get AQI alerts for Parīchhatgarh
Notify me when air quality reaches:
Free · No account · Unsubscribe any time
Data sources: AQI from ground-level monitoring stations via AQICN. Weather forecast from ECMWF (IFS & CAMS models). AQI calculated using US EPA standard. Updated 2026-06-08T18:13 UTC.