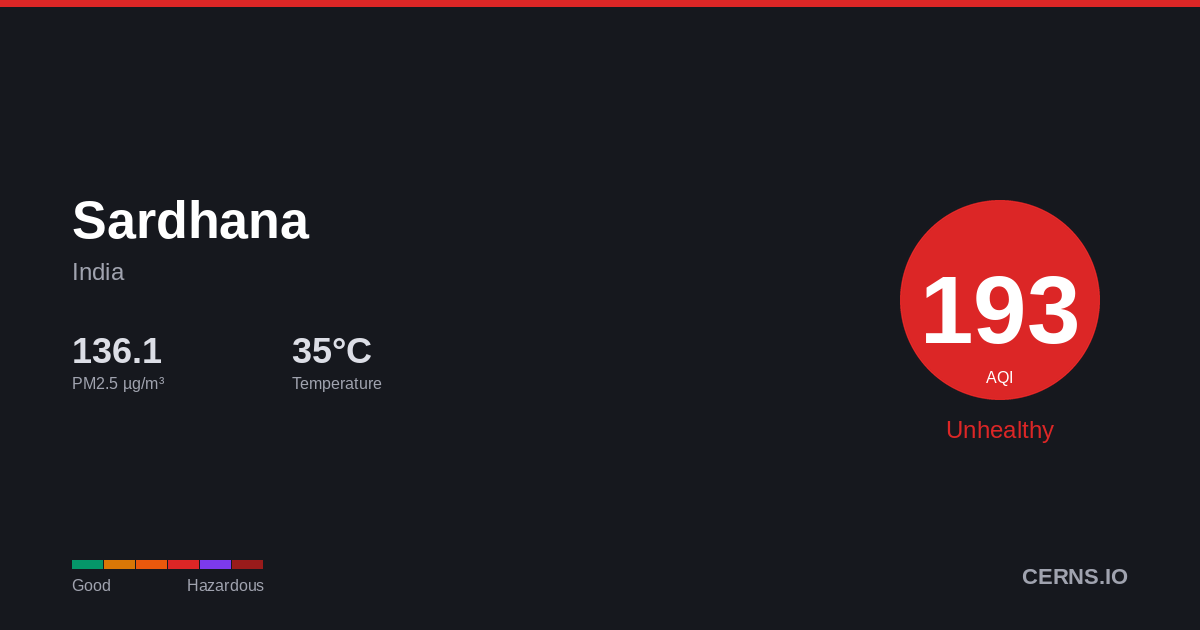
Air Quality in Sardhana, India
Drizzle
29.8°C · 57.6% humidity
29.8°
Feels 33.7°
225
Very unhealthy
Everyone should avoid outdoor exertion.
3 stations
Nearby Monitoring Stations
Sardhana's air quality — share it
AQI Forecast
Calibrated
238
9pm
238
238
225
12am
229
231
233
3am
248
249
249
6am
250
250
250
9am
251
238
223
12pm
223
160
160
3pm
160
160
161
6pm
223
223
Station readings
22h ago
AQI 160
PM2.5 73.3 µg/m³ · 22h ago
Air Quality Index Trend
47h · 15 stnSardhana's air quality is affected by vehicle emissions, industrial activity, and seasonal crop burning. Air quality typically worsens from November to February due to temperature inversions trapping pollutants near the surface. Current PM2.5 concentration in Sardhana is 11.7× the WHO 24-hour guideline of 15 µg/m³.
57.6%
Humidity
82.1 km/h
Wind NW
994.2 hPa
Pressure
0.7
UV Low
GoodModerateUSGUnhealthyVery UnhealthyHazardous
Which pollutant is driving the AQI?
PM2.5▲
175.11 µg/m³
PM10
329.9 µg/m³
050100150200300500
What is the weather forecast for Sardhana?
Temperature & Precipitation
PM2.5 Trend
47h · 15 stationsPM2.5175.11 µg/m³
×11.7 WHO
Very unhealthy
PM10329.9 µg/m³
Unhealthy
UV INDEX0.7
Low
Station readings (3 stations within 25 km)
175.11
Median
165.57
Average
96.2
Low
300.5
High
PM2.5 µg/m³ · Model: 51.48 · Bias: -123.6
Both models agree
Avg diff: 6.1°C
Where are air quality stations near Sardhana?
18
Pallavpuram Phase 2, Meerut, India
3
Pallavpuram Phase 2, Meerut, India
16
Pallavpuram Phase 2, Meerut, India
308
MIET College, Meerut
89
Ganga Nagar, Meerut, India
61
Ganga Nagar, Meerut, India
9
Jai Bhim Nagar, Meerut, India
19
Jai Bhim Nagar, Meerut, India
–
Jai Bhim Nagar, Meerut, India
What cities are near Sardhana?
Get AQI alerts for Sardhana
Notify me when air quality reaches:
Free · No account · Unsubscribe any time
Data sources: AQI from ground-level monitoring stations via AQICN. Weather forecast from ECMWF (IFS & CAMS models). AQI calculated using US EPA standard. Updated 2026-06-08T19:34 UTC.