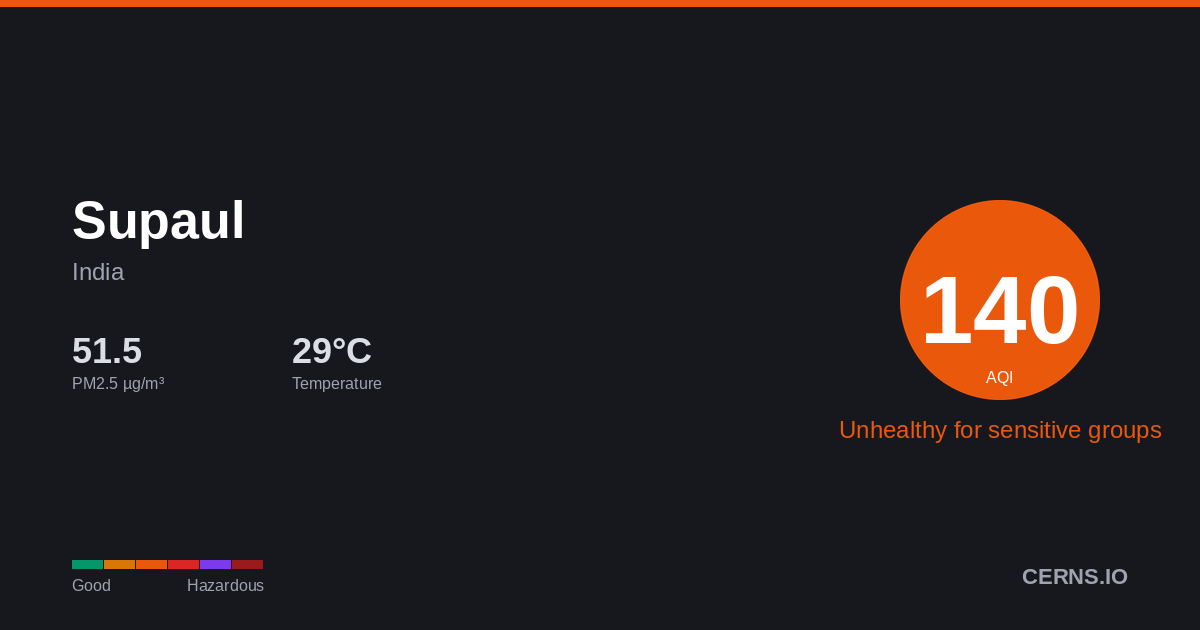
Air Quality in Supaul, India
Windy
35.6°C · 52.2% humidity
35.6°
Feels 41.6°
24
Good
Air quality is satisfactory. Enjoy outdoor activities.
1 station
Nearby Monitoring Stations
Supaul's air quality — share it
AQI Forecast
Calibrated
138
7am
138
139
24
10am
57
80
97
1pm
109
117
123
4pm
128
193
195
7pm
197
136
137
10pm
137
138
137
1am
137
138
138
4am
138
138
Station readings
32h ago
AQI 201
PM2.5 150.5 µg/m³ · 32h ago
Air Quality Index Trend
28h · 1 stnSupaul's air quality is affected by vehicle emissions, industrial activity, and seasonal crop burning. Air quality typically worsens from November to February due to temperature inversions trapping pollutants near the surface.
52.2%
Humidity
103.6 km/h
Wind E
996.3 hPa
Pressure
12.9
UV Extreme
GoodModerateUSGUnhealthyVery UnhealthyHazardous
Which pollutant is driving the AQI?
PM2.5
5.8 µg/m³
PM10▲
104.9 µg/m³
050100150200300500
What is the weather forecast for Supaul?
Temperature & Precipitation
PM2.5 Trend
28h · 1 stationPM2.55.8 µg/m³
✓ WHO
Good
PM10104.9 µg/m³
Moderate
UV INDEX12.9
Extreme
Station readings (1 station within 25 km)
5.8
Median
5.8
Average
5.8
Low
5.8
High
PM2.5 µg/m³ · Model: 40.85 · Bias: +35.0
What is the 7-day forecast for Supaul?
06-09
35.6° 26.1°
0.94 mm
06-10
34.5° 25.9°
4.25 mm
06-11
31.0° 25.6°
3.0 mm
06-12
38.3° 26.7°
0.63 mm
06-13
33.8° 28.3°
0.81 mm
06-14
38.5° 26.3°
0.25 mm
06-15
32.7° 27.9°
0.38 mm
Both models agree
Avg diff: 1.8°C
Where are air quality stations near Supaul?
27
Police Line, Saharsa, India
14
Police Line, Saharsa, India
15
Police Line, Saharsa, India
30
Police Line, Saharsa, India
154
Police Line, Saharsa, India
49
Police Line, Saharsa, India
What cities are near Supaul?
Get AQI alerts for Supaul
Notify me when air quality reaches:
Free · No account · Unsubscribe any time
Data sources: AQI from ground-level monitoring stations via AQICN. Weather forecast from ECMWF (IFS & CAMS models). AQI calculated using US EPA standard. Updated 2026-06-09T05:01 UTC.