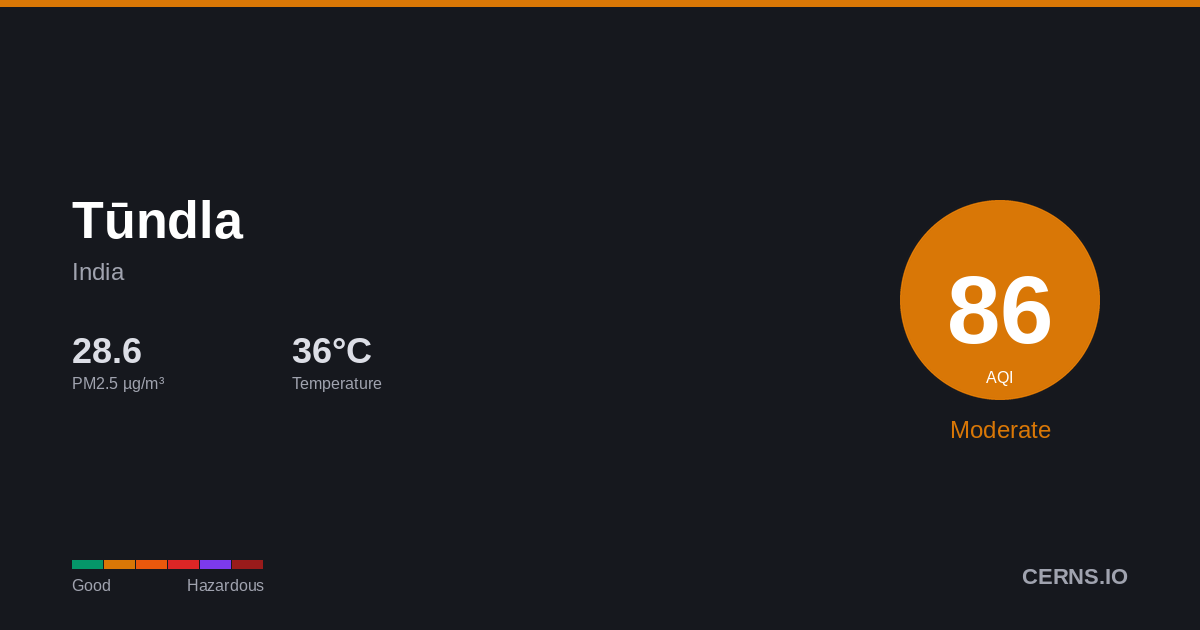
Air Quality in Tūndla, India
Windy
36.2°C · 30.5% humidity
36.2°
Feels 36.2°
86
Moderate
Unusually sensitive people should consider reducing prolonged outdoor exertion.
6 stations
Nearby Monitoring Stations
Tūndla's air quality — share it
AQI Forecast
Calibrated
56
4am
56
56
86
7am
82
92
90
10am
88
74
73
1pm
72
57
72
4pm
72
71
71
7pm
71
56
56
10pm
56
56
0
1am
0
56
Station readings
29h ago
AQI 71
PM2.5 21.4 µg/m³ · 29h ago
Air Quality Index Trend
45h · 5 stnTūndla's air quality is affected by vehicle emissions, industrial activity, and seasonal crop burning. Air quality typically worsens from November to February due to temperature inversions trapping pollutants near the surface. Current PM2.5 concentration in Tūndla is 1.9× the WHO 24-hour guideline of 15 µg/m³.
30.5%
Humidity
59.0 km/h
Wind WSW
993.8 hPa
Pressure
2.9
UV Moderate
GoodModerateUSGUnhealthyVery UnhealthyHazardous
Which pollutant is driving the AQI?
PM2.5
28.9 µg/m³
PM10▲
379.95 µg/m³
050100150200300500
What is the weather forecast for Tūndla?
Temperature & Precipitation
PM2.5 Trend
45h · 5 stationsPM2.528.9 µg/m³
×1.9 WHO
Moderate
PM10379.95 µg/m³
Very unhealthy
UV INDEX2.9
Moderate
Station readings (6 stations within 25 km)
28.9
Median
30.1
Average
22.1
Low
40.8
High
PM2.5 µg/m³ · Model: 51.03 · Bias: +22.1
What is the 7-day forecast for Tūndla?
06-09
44.6° 36.2°
06-10
44.7° 35.6°
06-11
44.0° 34.3°
1.19 mm
06-12
44.7° 32.4°
1.06 mm
06-13
45.3° 33.1°
1.31 mm
06-14
43.5° 35.7°
06-15
47.6° 36.4°
Both models agree
Avg diff: 5.0°C
Where are air quality stations near Tūndla?
41
Nagla Bhau, Firozabad, India
14
Nagla Bhau, Firozabad, India
6
Nagla Bhau, Firozabad, India
88
Nagla Bhau, Firozabad, India
34
Vibhab Nagar, Firozabad, India
20
Vibhab Nagar, Firozabad, India
13
Shahjahan Garden, Agra, India
16
Shahjahan Garden, Agra, India
151
Shahjahan Garden, Agra, India
27
Shahjahan Garden, Agra, India
What cities are near Tūndla?
Get AQI alerts for Tūndla
Notify me when air quality reaches:
Free · No account · Unsubscribe any time
Data sources: AQI from ground-level monitoring stations via AQICN. Weather forecast from ECMWF (IFS & CAMS models). AQI calculated using US EPA standard. Updated 2026-06-09T02:23 UTC.