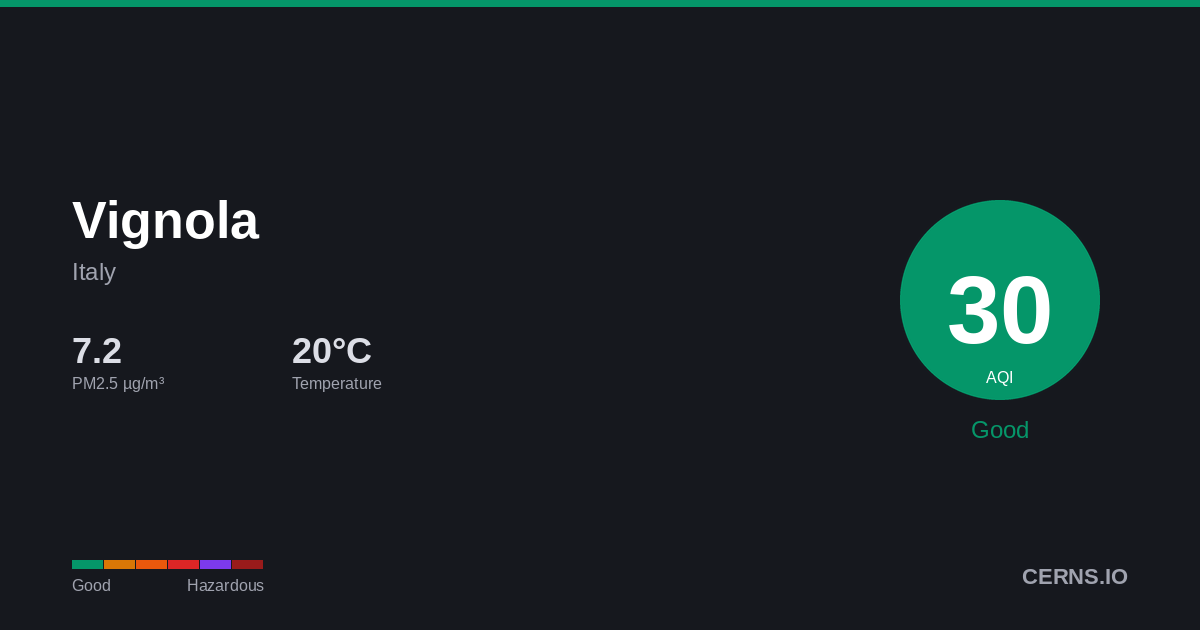
Air Quality in Vignola, Italy
Partly Cloudy
19.0°C · 61.3% humidity
19.0°
Feels 19.0°
37
Good
Air quality is satisfactory. Enjoy outdoor activities.
6 stations
Nearby Monitoring Stations
Vignola's air quality — share it
AQI Forecast
Calibrated
41
1am
53
41
37
4am
21
21
21
7am
21
21
21
10am
14
14
14
1pm
14
14
14
4pm
14
14
14
7pm
14
14
21
10pm
21
21
Station readings
67
61
20
CAMS model
adj -13
54
66
54
54
34
34
34
34
34
34
27
27
27
27
27
27
27
27
27
27
27
34
34
34
Air Quality Index Trend
47h · 1 stnVignola's air quality is shaped by traffic emissions and residential heating. Pollution levels tend to peak during winter months when cold air traps emissions close to ground level.
61.3%
Humidity
30.8 km/h
Wind SW
1012.4 hPa
Pressure
0.7
UV Low
GoodModerateUSGUnhealthyVery UnhealthyHazardous
Which pollutant is driving the AQI?
PM2.5▲
8.92 µg/m³
PM10
27.4 µg/m³
050100150200300500
What is the weather forecast for Vignola?
Temperature & Precipitation
PM2.5 Trend
47h · 1 stationPM2.58.92 µg/m³
✓ WHO
Good
PM1027.4 µg/m³
Good
UV INDEX0.7
Low
Station readings (6 stations within 25 km)
8.92
Median
8.86
Average
6.0
Low
13.75
High
PM2.5 µg/m³ · Model: 13.5 · Bias: +4.6
What is the 7-day forecast for Vignola?
06-09
26.5° 19.0°
0.06 mm
06-10
28.0° 18.6°
06-11
27.6° 19.0°
06-12
27.6° 18.6°
2.19 mm
06-13
31.8° 13.2°
0.69 mm
06-14
29.2° 20.0°
0.06 mm
06-15
32.6° 16.6°
3.75 mm
Both models agree
Avg diff: 2.3°C
Where are air quality stations near Vignola?
32
San Francesco, Emilia Romagna, Italy
74
San Francesco, Emilia Romagna, Italy
72
Parco Edilcarani, Emilia Romagna, Italy
21
Parco Edilcarani, Emilia Romagna, Italy
80
Giardini, Emilia Romagna, Italy
20
italy-modena-via-severino-fabriani
124
Parco Ferrari, Emilia Romagna, Italy
23
Tagliati, Emilia Romagna, Italy
18
Tagliati, Emilia Romagna, Italy
119
Via Chiarini, Emilia Romagna, Italy
What cities are near Vignola?
Get AQI alerts for Vignola
Notify me when air quality reaches:
Free · No account · Unsubscribe any time
Data sources: AQI from ground-level monitoring stations via AQICN. Weather forecast from ECMWF (IFS & CAMS models). AQI calculated using US EPA standard. Updated 2026-06-09T02:03 UTC.