Air Quality in Devínska Nová Ves, Slovakia
Drizzle
15.8°C · 95.8% humidity
15.8°
Feels 15.8°
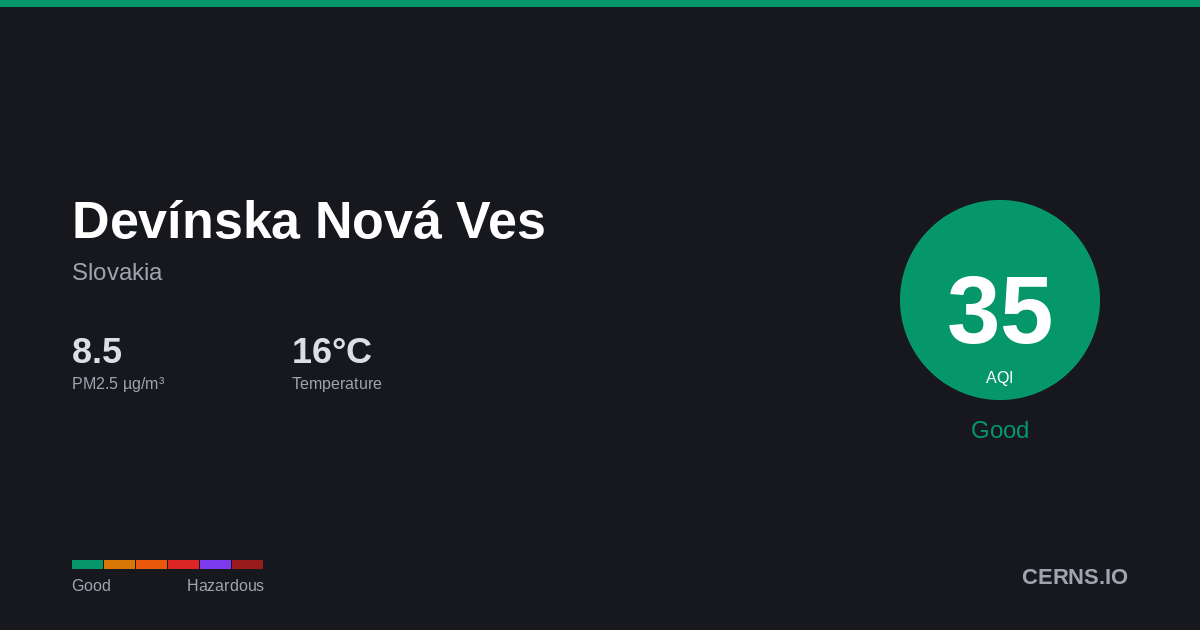
25
Good
Air quality is satisfactory. Enjoy outdoor activities.
13 stations
Nearby Monitoring Stations
Devínska Nová Ves's air quality — share it
AQI Forecast
Calibrated
34
5am
34
34
25
8am
30
31
33
11am
34
32
33
2pm
35
35
36
5pm
34
34
34
8pm
33
33
33
11pm
33
33
33
2am
33
33
Station readings
32h ago
AQI 36
PM2.5 8.7 µg/m³ · 32h ago
Air Quality Index Trend
48h · 9 stnDevínska Nová Ves's air quality is shaped by traffic emissions and residential heating. Pollution levels tend to peak during winter months when cold air traps emissions close to ground level.
95.8%
Humidity
58.9 km/h
Wind NW
1015.6 hPa
Pressure
2.9
UV Moderate
GoodModerateUSGUnhealthyVery UnhealthyHazardous
Which pollutant is driving the AQI?
PM2.5▲
6.08 µg/m³
PM10
13.7 µg/m³
050100150200300500
What is the weather forecast for Devínska Nová Ves?
Temperature & Precipitation
PM2.5 Trend
48h · 9 stationsPM2.56.08 µg/m³
✓ WHO
Good
PM1013.7 µg/m³
Good
UV INDEX2.9
Moderate
Station readings (13 stations within 25 km)
6.08
Median
6.41
Average
3.1
Low
10.0
High
PM2.5 µg/m³ · Model: 6.25 · Bias: +0.2
What is the 7-day forecast for Devínska Nová Ves?
06-09
22.3° 15.8°
12.94 mm
06-10
21.7° 15.9°
1.75 mm
06-11
15.0° 13.7°
10.63 mm
06-12
26.0° 15.6°
0.44 mm
06-13
20.3° 11.8°
16.38 mm
06-14
28.7° 16.0°
12.25 mm
06-15
32.0° 10.0°
0.62 mm
Both models agree
Avg diff: 3.5°C
Where are air quality stations near Devínska Nová Ves?
15
Parkplatz Bezirkskrankenhaus, Florianistraße, Austria
26
Jeseniova, Bratislava, Slovakia
28
Kamenne nam., Bratislava, Slovakia
38
Bratislava, Trnavske Myto
3
Puchovska, Bratislava, Slovakia
36
Puchovska, Bratislava, Slovakia
33
Vlčie Hrdlo, Bratislava
42
Pod. Biskupice, Bratislava
17
Rovinka
25
mobilna AMS, Rovinka, Slovakia
What cities are near Devínska Nová Ves?
Get AQI alerts for Devínska Nová Ves
Notify me when air quality reaches:
Free · No account · Unsubscribe any time
Data sources: AQI from ground-level monitoring stations via AQICN. Weather forecast from ECMWF (IFS & CAMS models). AQI calculated using US EPA standard. Updated 2026-06-09T06:48 UTC.