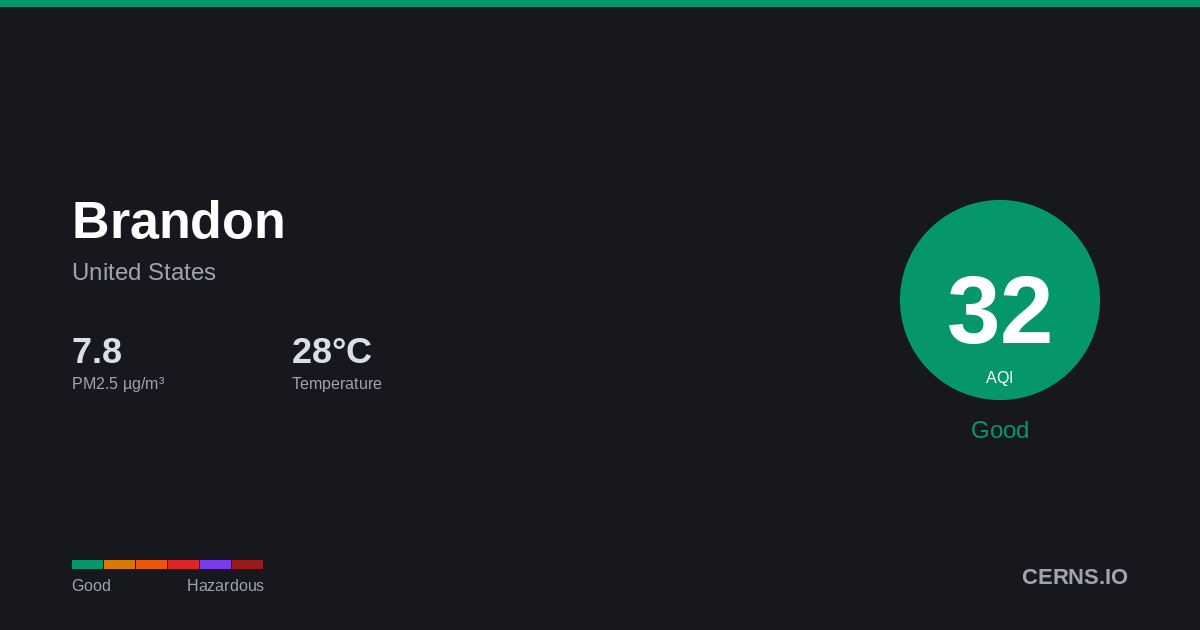
Air Quality in Brandon, United States
Drizzle
28.8°C · 68.4% humidity
28.8°
Feels 33.8°
44
Good
Air quality is satisfactory. Enjoy outdoor activities.
24 stations
Nearby Monitoring Stations
Brandon's air quality — share it
AQI Forecast
Calibrated
19
7pm
19
19
44
10pm
37
32
28
1am
26
24
22
4am
21
21
20
7am
20
22
21
10am
21
19
19
1pm
19
19
19
4pm
19
19
Station readings
18
16
CAMS model
adj -6
25
25
25
25
25
25
25
25
25
25
25
25
25
25
27
27
27
25
25
25
25
25
25
25
Air Quality Index Trend
25h · 1 stnBrandon's air quality is primarily affected by vehicle emissions and industrial activity. Seasonal wildfire smoke and weather patterns can cause periodic air quality deterioration.
68.4%
Humidity
97.5 km/h
Wind W
1013.0 hPa
Pressure
0.7
UV Low
GoodModerateUSGUnhealthyVery UnhealthyHazardous
Which pollutant is driving the AQI?
PM2.5▲
10.48 µg/m³
PM10
13.7 µg/m³
050100150200300500
What is the weather forecast for Brandon?
Temperature & Precipitation
PM2.5 Trend
25h · 1 stationPM2.510.48 µg/m³
✓ WHO
Good
PM1013.7 µg/m³
Good
UV INDEX0.7
Low
Station readings (24 stations within 25 km)
10.48
Median
11.25
Average
7.36
Low
21.6
High
PM2.5 µg/m³ · Model: 6.0 · Bias: -4.5
What is the 7-day forecast for Brandon?
06-09
31.5° 25.4°
2.0 mm
06-10
33.3° 24.8°
1.88 mm
06-11
28.7° 26.6°
15.56 mm
06-12
31.2° 26.9°
7.69 mm
06-13
32.0° 24.6°
0.06 mm
06-14
31.0° 23.0°
18.87 mm
06-15
32.5° 24.2°
9.0 mm
Both models agree
Avg diff: 1.9°C
Where are air quality stations near Brandon?
49
Hillsborough Community College - Brandon
31
Sydney Station
65
Sydney, Hillsborough, Florida, USA
42
Sydney, Hillsborough, Florida, USA
46
Mary Help of Christians Center
50
Highland Pines Community Garden
29
Gardinier Park, Hillsborough, Florida, USA
34
Gardinier Park, Hillsborough, Florida, USA
49
New Mount Zion Church
40
Cornerstone Family Ministries
What cities are near Brandon?
Get AQI alerts for Brandon
Notify me when air quality reaches:
Free · No account · Unsubscribe any time
Data sources: AQI from ground-level monitoring stations via AQICN. Weather forecast from ECMWF (IFS & CAMS models). AQI calculated using US EPA standard. Updated 2026-06-09T02:17 UTC.