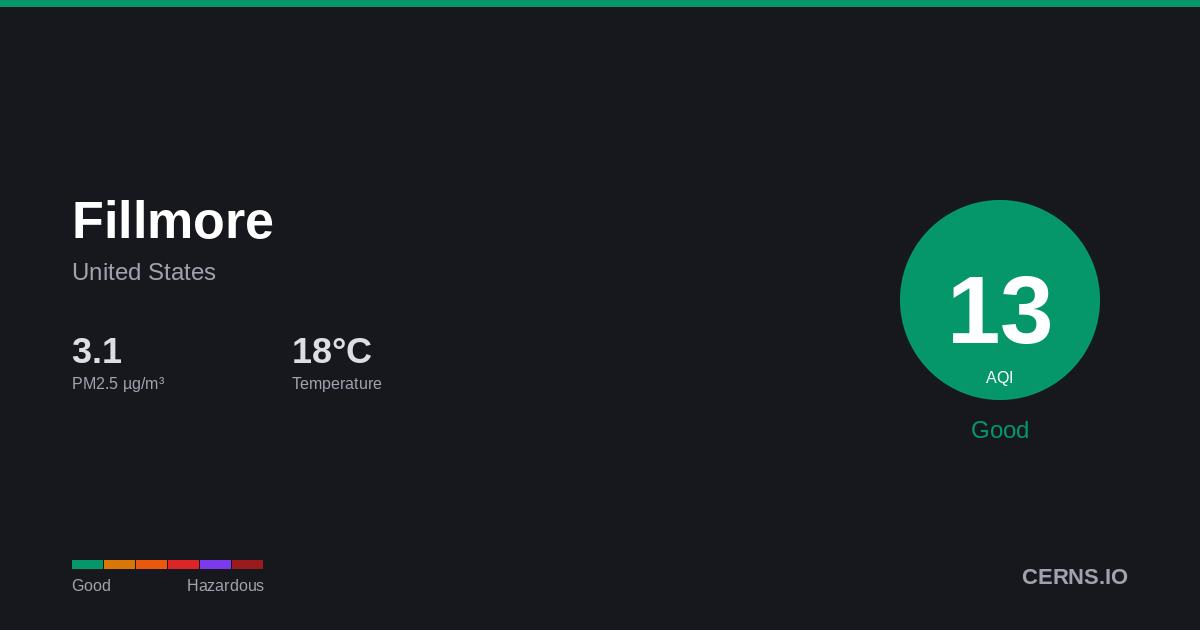
Air Quality in Fillmore, United States
Windy
28.3°C · 20.5% humidity
28.3°
Feels 28.3°
44
Good
Air quality is satisfactory. Enjoy outdoor activities.
3 stations
Nearby Monitoring Stations
Fillmore's air quality — share it
AQI Forecast
Calibrated
29
2pm
29
29
44
5pm
40
17
15
8pm
13
12
31
11pm
30
30
30
2am
30
29
29
5am
29
29
29
8am
29
29
29
11am
29
29
Station readings
35
19
30
27
CAMS model
adj -25
54
54
54
54
54
34
34
34
34
54
54
54
54
54
54
54
54
54
54
54
54
54
54
54
Air Quality Index Trend
48h · 1 stnFillmore's air quality is primarily affected by vehicle emissions and industrial activity. Seasonal wildfire smoke and weather patterns can cause periodic air quality deterioration.
20.5%
Humidity
41.9 km/h
Wind SSE
1009.6 hPa
Pressure
6.9
UV High
GoodModerateUSGUnhealthyVery UnhealthyHazardous
Which pollutant is driving the AQI?
PM2.5▲
10.52 µg/m³
PM10
27.4 µg/m³
050100150200300500
What is the weather forecast for Fillmore?
Temperature & Precipitation
PM2.5 Trend
48h · 1 stationPM2.510.52 µg/m³
✓ WHO
Good
PM1027.4 µg/m³
Good
UV INDEX6.9
High
Station readings (3 stations within 25 km)
10.52
Median
10.4
Average
6.01
Low
13.1
High
PM2.5 µg/m³ · Model: 10.85 · Bias: +0.3
What is the 7-day forecast for Fillmore?
06-09
28.3° 13.9°
06-10
29.9° 14.9°
06-11
27.8° 15.8°
06-12
30.8° 16.5°
06-13
32.8° 17.4°
06-14
28.4° 19.5°
06-15
24.7° 11.5°
Both models agree
Avg diff: 3.4°C
Where are air quality stations near Fillmore?
27
Piru - Pacific, Ventura, California
27
united-states-of-america-moorpark-fishers-court
42
Thousand Oaks-Moorpark Road, Ventura, California
34
Simi Valley - Cochran Street, Ventura, California
55
El Rio-Rio Mesa School #2, Ventura, California
45
Haynes ES (4473)
What cities are near Fillmore?
Get AQI alerts for Fillmore
Notify me when air quality reaches:
Free · No account · Unsubscribe any time
Data sources: AQI from ground-level monitoring stations via AQICN. Weather forecast from ECMWF (IFS & CAMS models). AQI calculated using US EPA standard. Updated 2026-06-09T00:40 UTC.