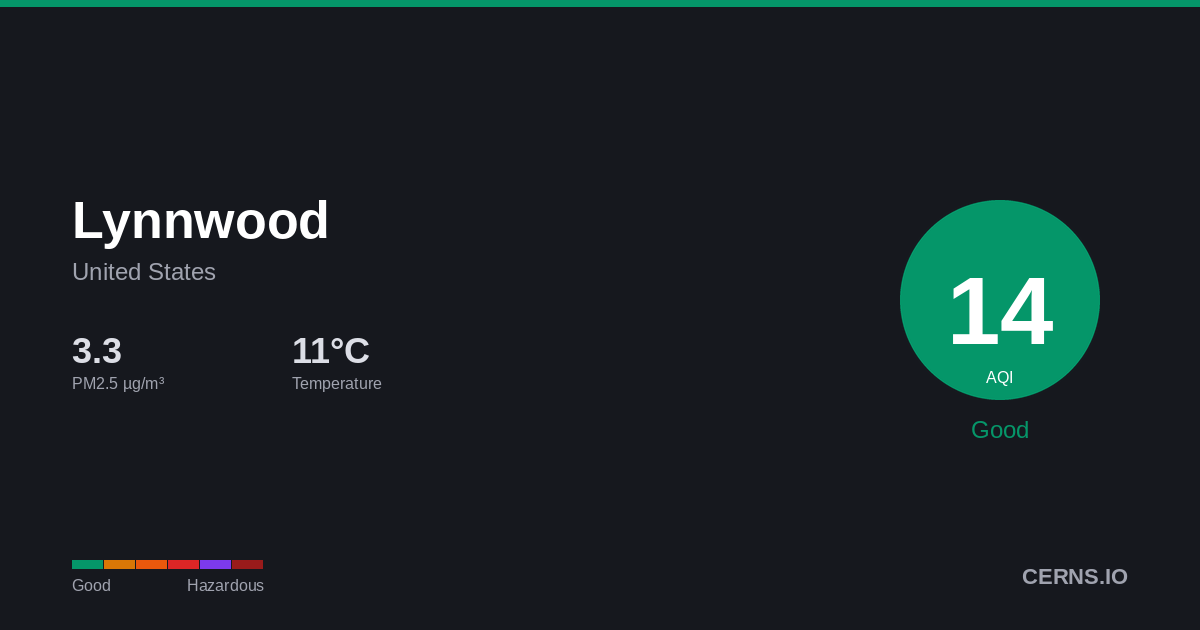
Air Quality in Lynnwood, United States
Drizzle
10.6°C · 76.9% humidity
10.6°
Feels 10.6°
12
Good
Air quality is satisfactory. Enjoy outdoor activities.
10 stations
Nearby Monitoring Stations
Lynnwood's air quality — share it
AQI Forecast
Calibrated
13
5pm
13
13
12
8pm
13
13
13
11pm
13
13
13
2am
13
13
13
5am
13
13
13
8am
13
13
13
11am
13
15
15
2pm
15
15
Station readings
12
12
21
17
CAMS model
adj -12
25
25
25
25
25
25
25
25
25
25
25
25
25
25
25
25
25
25
25
25
27
27
27
27
Air Quality Index Trend
48h · 1 stnLynnwood's air quality is primarily affected by vehicle emissions and industrial activity. Seasonal wildfire smoke and weather patterns can cause periodic air quality deterioration.
76.9%
Humidity
49.9 km/h
Wind S
1019.0 hPa
Pressure
0.7
UV Low
GoodModerateUSGUnhealthyVery UnhealthyHazardous
Which pollutant is driving the AQI?
PM2.5
2.82 µg/m³
PM10▲
13.7 µg/m³
050100150200300500
What is the weather forecast for Lynnwood?
Temperature & Precipitation
PM2.5 Trend
48h · 1 stationPM2.52.82 µg/m³
✓ WHO
Good
PM1013.7 µg/m³
Good
UV INDEX0.7
Low
Station readings (10 stations within 25 km)
2.82
Median
2.94
Average
0.93
Low
5.9
High
PM2.5 µg/m³ · Model: 5.9 · Bias: +3.1
What is the 7-day forecast for Lynnwood?
06-09
14.5° 8.9°
0.5 mm
06-10
19.3° 10.3°
06-11
21.3° 7.6°
06-12
30.9° 11.8°
0.06 mm
06-13
29.9° 6.9°
06-14
22.9° 10.1°
0.31 mm
06-15
23.7° 8.6°
0.63 mm
Both models agree
Avg diff: 4.0°C
Where are air quality stations near Lynnwood?
14
Town Center, Lake Forest Park, Washington, USA
4
Everett-Beverly Park Rd
14
Seattle-Linden Ave N
15
Seattle-NE 127th St
13
Seattle-College Way N
17
AireCiudadano USA Seat 01 27a3fd
23
Wallingford Playfield
8
Everett-Rucker Ave
4
Everett-12th St
3
Olive St, Seattle, Washington, USA
What cities are near Lynnwood?
Get AQI alerts for Lynnwood
Notify me when air quality reaches:
Free · No account · Unsubscribe any time
Data sources: AQI from ground-level monitoring stations via AQICN. Weather forecast from ECMWF (IFS & CAMS models). AQI calculated using US EPA standard. Updated 2026-06-09T03:40 UTC.