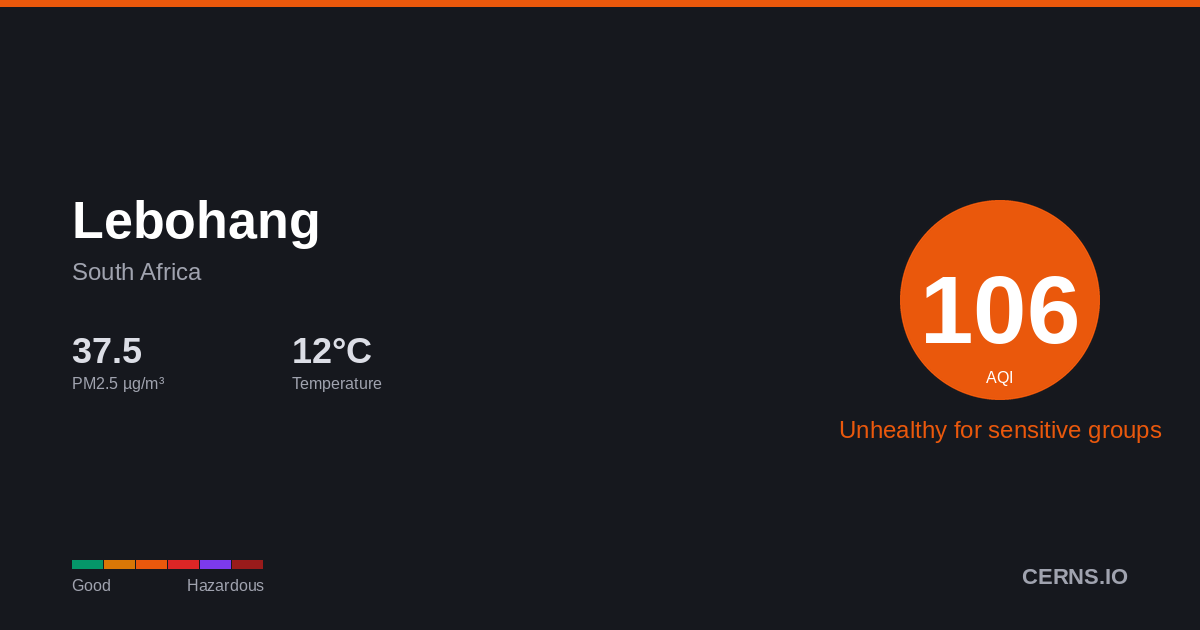
Air Quality in Lebohang, South Africa
Clear
11.9°C · 21.7% humidity
11.9°
Feels 11.9°
106
Unhealthy for sensitive groups
Sensitive groups should reduce prolonged outdoor exertion.
1 station
Nearby Monitoring Stations
Lebohang's air quality — share it
AQI Forecast
54
6pm
66
66
106
9pm
112
104
98
12am
94
92
59
3am
58
57
56
6am
55
67
55
9am
35
27
25
12pm
25
25
24
3pm
24
25
Air Quality Index Trend
35h · 4 stnLebohang's air quality is influenced by vehicle emissions, biomass burning, dust, and industrial activity. Dry seasons and Harmattan winds can significantly elevate particulate pollution levels. Current PM2.5 concentration in Lebohang is 2.5× the WHO 24-hour guideline of 15 µg/m³.
21.7%
Humidity
13.8 km/h
Wind S
1027.7 hPa
Pressure
0.7
UV Low
GoodModerateUSGUnhealthyVery UnhealthyHazardous
Which pollutant is driving the AQI?
PM2.5▲
37.5 µg/m³
PM10
98.05 µg/m³
050100150200300500
What is the weather forecast for Lebohang?
Temperature & Precipitation
PM2.5 Trend
35h · 4 stationsPM2.537.5 µg/m³
×2.5 WHO
Unhealthy for sensitive groups
PM1098.05 µg/m³
Moderate
UV INDEX0.7
Low
Station readings (1 station within 25 km)
37.5
Median
37.5
Average
37.5
Low
37.5
High
PM2.5 µg/m³ · Model: 36.45 · Bias: -1.0
What is the 7-day forecast for Lebohang?
06-08
18.4° 8.1°
06-09
20.0° 11.4°
06-10
17.7° 6.6°
06-11
17.2° 8.2°
06-12
15.5° 9.6°
1.31 mm
06-13
17.2° 6.6°
06-14
22.4° 8.2°
Both models agree
Avg diff: 2.8°C
Where are air quality stations near Lebohang?
49
Lebohang, Gert Sibande, South Africa
27
Lebohang, Gert Sibande, South Africa
29
eMbalenhle North, Gert Sibande, South Africa
31
Secunda, Gert Sibande, South Africa
43
Embalenhle, Gert Sibande, South Africa
What cities are near Lebohang?
Get AQI alerts for Lebohang
Notify me when air quality reaches:
Free · No account · Unsubscribe any time
Data sources: AQI from ground-level monitoring stations via AQICN. Weather forecast from ECMWF (IFS & CAMS models). AQI calculated using US EPA standard. Updated 2026-06-08T19:30 UTC.