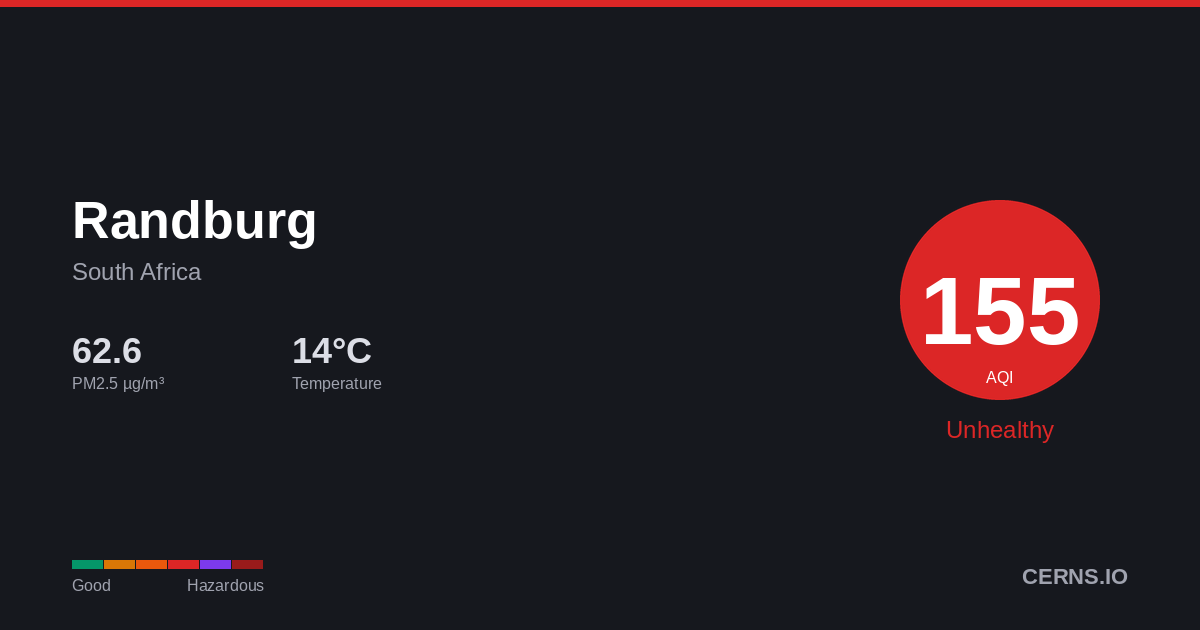
Air Quality in Randburg, South Africa
Clear
14.7°C · 36.3% humidity
14.7°
Feels 14.7°
159
Unhealthy
Everyone should reduce prolonged outdoor exertion.
10 stations
Nearby Monitoring Stations
Randburg's air quality — share it
AQI Forecast
Calibrated
75
7pm
90
90
159
10pm
139
125
100
1am
93
103
99
4am
97
95
106
7am
118
92
14
10am
1
1
0
1pm
0
0
0
4pm
0
0
Station readings
63
68
68
77
CAMS model
adj -71
146
161
161
161
161
161
146
146
161
161
161
161
174
187
161
84
66
54
54
54
54
54
54
66
Air Quality Index Trend
48h · 1 stnRandburg's air quality is influenced by vehicle emissions, biomass burning, dust, and industrial activity. Dry seasons and Harmattan winds can significantly elevate particulate pollution levels. Current PM2.5 concentration in Randburg is 4.7× the WHO 24-hour guideline of 15 µg/m³.
36.3%
Humidity
19.8 km/h
Wind NW
1027.1 hPa
Pressure
0.7
UV Low
GoodModerateUSGUnhealthyVery UnhealthyHazardous
Which pollutant is driving the AQI?
PM2.5▲
70.46 µg/m³
PM10
154.9 µg/m³
050100150200300500
What is the weather forecast for Randburg?
Temperature & Precipitation
PM2.5 Trend
48h · 1 stationPM2.570.46 µg/m³
×4.7 WHO
Unhealthy
PM10154.9 µg/m³
Unhealthy for sensitive groups
UV INDEX0.7
Low
Station readings (10 stations within 25 km)
70.46
Median
115.04
Average
6.2
Low
315.8
High
PM2.5 µg/m³ · Model: 64.32 · Bias: -6.1
What is the 7-day forecast for Randburg?
06-08
18.5° 11.4°
06-09
20.7° 13.5°
06-10
18.1° 9.9°
06-11
17.5° 10.7°
06-12
16.9° 10.7°
0.06 mm
06-13
17.5° 10.1°
06-14
22.4° 11.3°
Both models agree
Avg diff: 3.5°C
Where are air quality stations near Randburg?
77
south-africa-randburg-bloubosrand
27
Alexandra-NAQI, City of Johannesburg, South Africa
47
Alexandra-NAQI, City of Johannesburg, South Africa
35
Buccleugh-NAQI, City of Johannesburg, South Africa
36
Davidsonville, City of Johannesburg, South Africa
55
Diepsloot, City of Johannesburg, South Africa
35
Diepsloot, City of Johannesburg, South Africa
53
Diepsloot, City of Johannesburg, South Africa
30
Jabavu-NAQI, City of Johannesburg, South Africa
21
Ivory Park, City of Johannesburg, South Africa
What cities are near Randburg?
Get AQI alerts for Randburg
Notify me when air quality reaches:
Free · No account · Unsubscribe any time
Data sources: AQI from ground-level monitoring stations via AQICN. Weather forecast from ECMWF (IFS & CAMS models). AQI calculated using US EPA standard. Updated 2026-06-08T20:42 UTC.