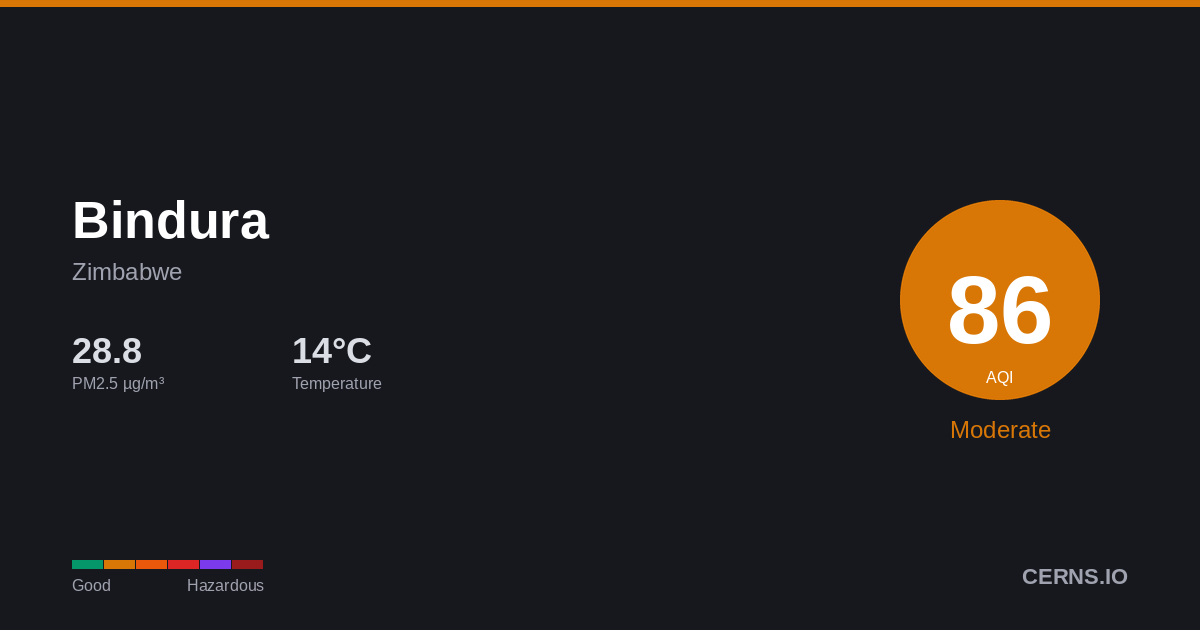
Air Quality in Bindura, Zimbabwe
Overcast
10.2°C · 94.4% humidity
10.2°
Feels 10.2°
77
Moderate
Unusually sensitive people should consider reducing prolonged outdoor exertion.
Calibrated model
Nearby Monitoring Stations
Bindura's air quality — share it
AQI Forecast
54
1am
54
54
77
4am
82
78
74
7am
60
58
37
10am
36
29
28
1pm
28
28
27
4pm
27
34
54
7pm
54
54
54
10pm
54
54
Bindura's air quality is influenced by vehicle emissions, biomass burning, dust, and industrial activity. Dry seasons and Harmattan winds can significantly elevate particulate pollution levels. Current PM2.5 concentration in Bindura is 1.6× the WHO 24-hour guideline of 15 µg/m³.
94.4%
Humidity
7.7 km/h
Wind WSW
1024.7 hPa
Pressure
0.7
UV Low
GoodModerateUSGUnhealthyVery UnhealthyHazardous
Which pollutant is driving the AQI?
PM2.5▲
24.52 µg/m³
PM10
41.15 µg/m³
050100150200300500
What is the weather forecast for Bindura?
Temperature & Precipitation
PM2.524.52 µg/m³
×1.6 WHO
Moderate
PM1041.15 µg/m³
Good
UV INDEX0.7
Low
What is the 7-day forecast for Bindura?
06-09
27.1° 10.2°
06-10
26.6° 13.0°
06-11
26.5° 10.1°
1.06 mm
06-12
28.0° 11.5°
06-13
29.7° 9.1°
06-14
29.3° 11.1°
06-15
24.8° 11.9°
Both models agree
Avg diff: 2.6°C
What cities are near Bindura?
Get AQI alerts for Bindura
Notify me when air quality reaches:
Free · No account · Unsubscribe any time
Data sources: AQI from ground-level monitoring stations via AQICN. Weather forecast from ECMWF (IFS & CAMS models). AQI calculated using US EPA standard. Updated 2026-06-09T02:17 UTC.