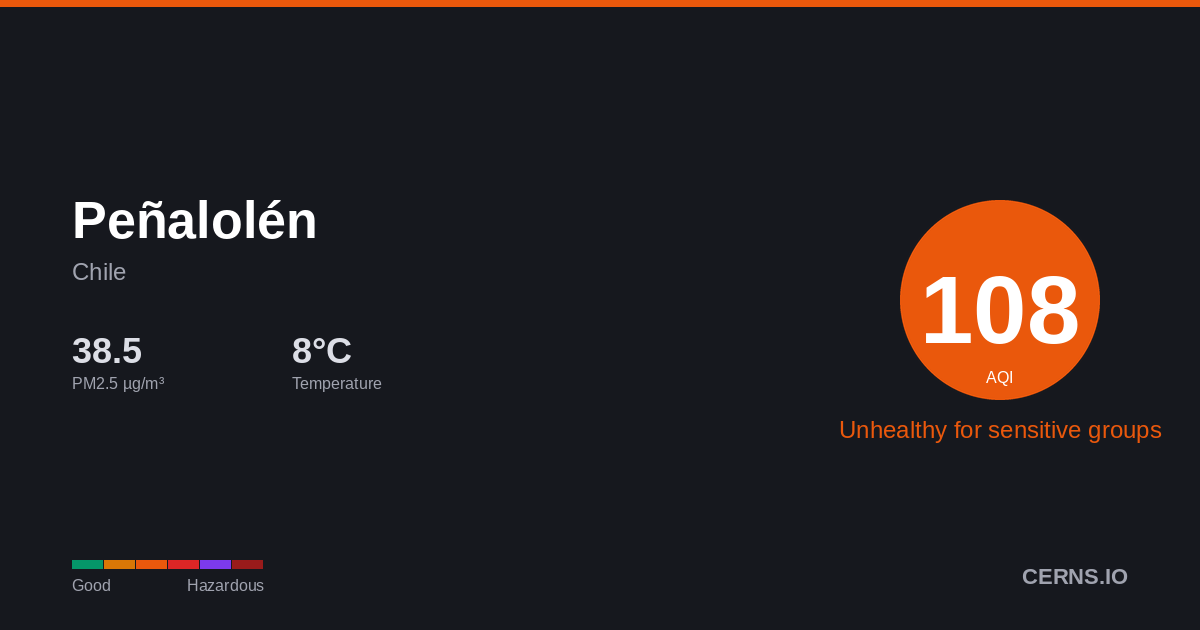
Air Quality in Peñalolén, Chile
Cloudy
8.7°C · 73.8% humidity
8.7°
Feels 6.4°
119
Unhealthy for sensitive groups
Sensitive groups should reduce prolonged outdoor exertion.
173 stations
Nearby Monitoring Stations
Peñalolén's air quality — share it
AQI Forecast
Calibrated
150
4pm
130
119
119
7pm
125
129
132
10pm
134
136
117
1am
118
112
110
4am
110
109
110
7am
111
120
140
10am
140
152
152
1pm
169
169
Station readings
150
130
119
110
CAMS model
adj +86
54
54
54
54
54
54
54
54
54
34
34
27
25
25
24
24
25
34
54
54
66
66
83
83
Air Quality Index Trend
48h · 85 stnPeñalolén's air quality is influenced by vehicle emissions, industrial activity, and seasonal agricultural burning. Pollution patterns vary with dry and wet seasons. Current PM2.5 concentration in Peñalolén is 2.8× the WHO 24-hour guideline of 15 µg/m³.
73.8%
Humidity
14.7 km/h
Wind WSW
1019.0 hPa
Pressure
0.7
UV Low
GoodModerateUSGUnhealthyVery UnhealthyHazardous
Which pollutant is driving the AQI?
PM2.5▲
42.69 µg/m³
PM10
166.15 µg/m³
050100150200300500
What is the weather forecast for Peñalolén?
Temperature & Precipitation
PM2.5 Trend
48h · 85 stationsPM2.542.69 µg/m³
×2.8 WHO
Unhealthy for sensitive groups
PM10166.15 µg/m³
Unhealthy for sensitive groups
UV INDEX0.7
Low
Station readings (173 stations within 25 km)
42.69
Median
42.39
Average
11.5
Low
355.0
High
PM2.5 µg/m³ · Model: 56.72 · Bias: +14.0
What is the 7-day forecast for Peñalolén?
06-08
15.5° 10.6°
06-09
12.3° 7.8°
06-10
18.5° 7.3°
6.44 mm
06-11
15.9° 10.2°
6.37 mm
06-12
12.8° 4.6°
0.88 mm
06-13
10.8° 7.7°
2.81 mm
06-14
16.4° -2.9°
0.13 mm
Both models agree
Avg diff: 3.5°C
Where are air quality stations near Peñalolén?
112
CHS 74 H S1 e1a65e
93
CHS 74 H P2 4a293a
147
CHS 50 P2 fc819a
144
CHS 50 P1 78489b
107
CHS 50 S1 4fe70d
17
CHS 50 N1 a83524
147
CHS 12 S1 ff87ad
134
CHS 12 P1 882cd8
155
CHS 12 P2 88e573
76
CHS 13 P2 121344
What cities are near Peñalolén?
Get AQI alerts for Peñalolén
Notify me when air quality reaches:
Free · No account · Unsubscribe any time
Data sources: AQI from ground-level monitoring stations via AQICN. Weather forecast from ECMWF (IFS & CAMS models). AQI calculated using US EPA standard. Updated 2026-06-08T23:25 UTC.