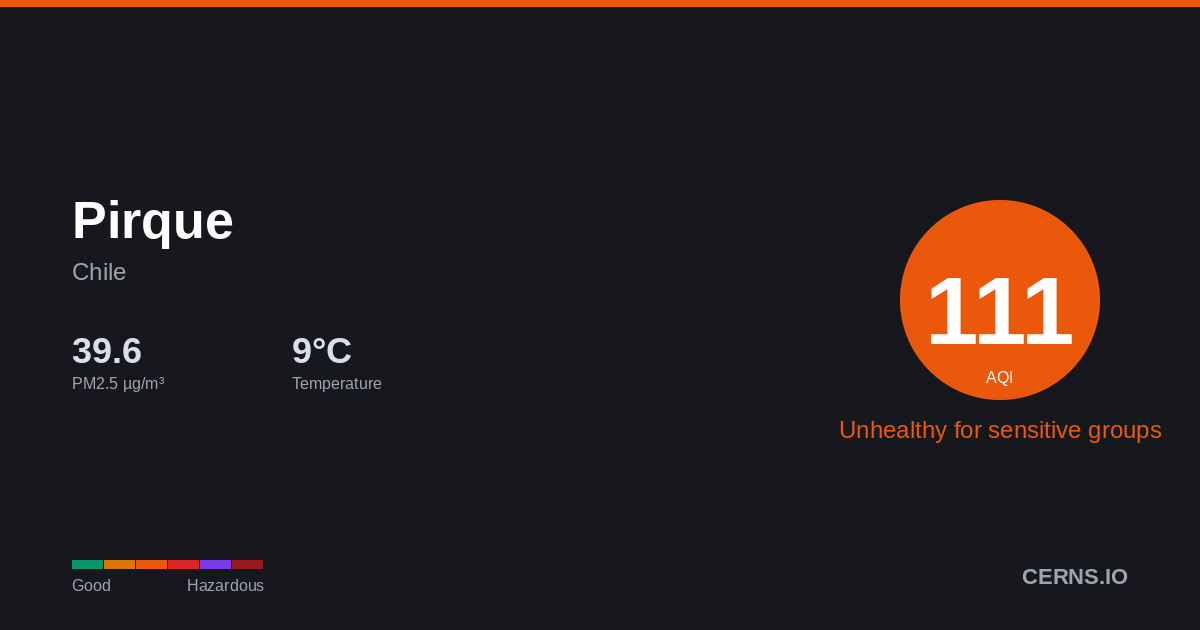
Air Quality in Pirque, Chile
Cloudy
8.7°C · 73.8% humidity
8.7°
Feels 6.4°
117
Unhealthy for sensitive groups
Sensitive groups should reduce prolonged outdoor exertion.
118 stations
Nearby Monitoring Stations
Pirque's air quality — share it
AQI Forecast
Calibrated
138
2pm
133
119
117
5pm
126
133
138
8pm
141
144
146
11pm
147
128
128
2am
122
120
120
5am
120
120
121
8am
130
150
150
11am
162
162
Station readings
138
133
119
105
CAMS model
adj +96
27
27
54
54
54
54
54
54
54
54
54
34
34
27
25
25
24
24
25
34
54
54
66
66
Air Quality Index Trend
48h · 65 stnPirque's air quality is influenced by vehicle emissions, industrial activity, and seasonal agricultural burning. Pollution patterns vary with dry and wet seasons. Current PM2.5 concentration in Pirque is 2.8× the WHO 24-hour guideline of 15 µg/m³.
73.8%
Humidity
14.7 km/h
Wind WSW
1019.0 hPa
Pressure
0.7
UV Low
GoodModerateUSGUnhealthyVery UnhealthyHazardous
Which pollutant is driving the AQI?
PM2.5▲
41.92 µg/m³
PM10
116.15 µg/m³
050100150200300500
What is the weather forecast for Pirque?
Temperature & Precipitation
PM2.5 Trend
48h · 65 stationsPM2.541.92 µg/m³
×2.8 WHO
Unhealthy for sensitive groups
PM10116.15 µg/m³
Moderate
UV INDEX0.7
Low
Station readings (118 stations within 25 km)
41.92
Median
42.37
Average
6.0
Low
71.0
High
PM2.5 µg/m³ · Model: 44.22 · Bias: +2.3
What is the 7-day forecast for Pirque?
06-08
15.5° 10.6°
06-09
12.3° 7.8°
06-10
18.5° 7.3°
6.44 mm
06-11
15.9° 10.2°
6.37 mm
06-12
12.8° 4.6°
0.88 mm
06-13
10.8° 7.7°
2.81 mm
06-14
16.4° -2.9°
0.13 mm
Both models agree
Avg diff: 3.2°C
Where are air quality stations near Pirque?
173
CHS 35 P2 1eabd8
124
CHS 35 S1 fcf483
134
CHS 35 P1 dee1b1
117
CHS 2 CON P1 f69ce9
147
CHS 2 P1 7b977
80
CHS 2 S1 88f0ac
137
CHS 2 P2 864a56
33
Puente Alto, Chile
76
Puente Alto, Chile
120
Puente Alto, Chile
What cities are near Pirque?
Get AQI alerts for Pirque
Notify me when air quality reaches:
Free · No account · Unsubscribe any time
Data sources: AQI from ground-level monitoring stations via AQICN. Weather forecast from ECMWF (IFS & CAMS models). AQI calculated using US EPA standard. Updated 2026-06-08T21:58 UTC.