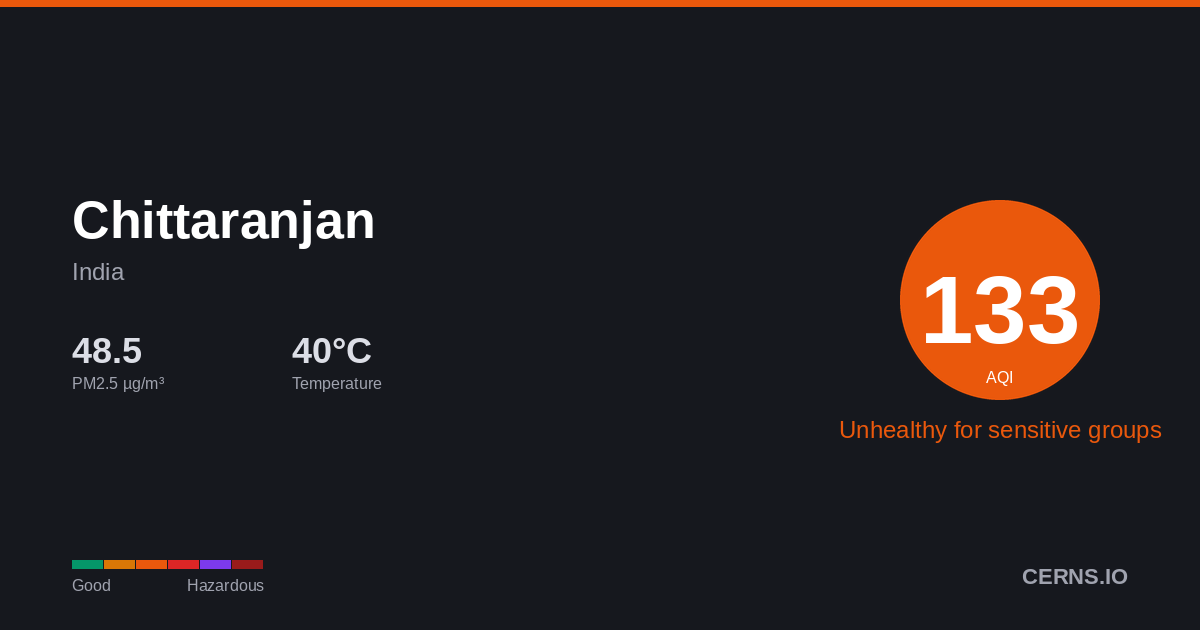
Air Quality in Chittaranjan, India
Windy
40.3°C · 35.2% humidity
40.3°
Feels 40.3°
134
Unhealthy for sensitive groups
Sensitive groups should reduce prolonged outdoor exertion.
8 stations
Nearby Monitoring Stations
Chittaranjan's air quality — share it
AQI Forecast
Calibrated
103
7am
103
103
134
10am
63
57
52
1pm
49
47
45
4pm
44
43
105
7pm
104
104
104
10pm
103
103
103
1am
103
103
103
4am
103
103
Station readings
32h ago
AQI 103
PM2.5 36.2 µg/m³ · 32h ago
Air Quality Index Trend
48h · 24 stnChittaranjan's air quality is affected by vehicle emissions, industrial activity, and seasonal crop burning. Air quality typically worsens from November to February due to temperature inversions trapping pollutants near the surface. Current PM2.5 concentration in Chittaranjan is 3.3× the WHO 24-hour guideline of 15 µg/m³.
35.2%
Humidity
56.9 km/h
Wind ESE
995.1 hPa
Pressure
17.4
UV Extreme
GoodModerateUSGUnhealthyVery UnhealthyHazardous
Which pollutant is driving the AQI?
PM2.5▲
48.96 µg/m³
PM10
129.9 µg/m³
050100150200300500
What is the weather forecast for Chittaranjan?
Temperature & Precipitation
PM2.5 Trend
48h · 24 stationsPM2.548.96 µg/m³
×3.3 WHO
Unhealthy for sensitive groups
PM10129.9 µg/m³
Moderate
UV INDEX17.4
Extreme
Station readings (8 stations within 25 km)
48.96
Median
45.58
Average
27.59
Low
67.28
High
PM2.5 µg/m³ · Model: 53.7 · Bias: +4.7
Both models agree
Avg diff: 3.9°C
Where are air quality stations near Chittaranjan?
136
DESHABANDHU MAHAVIDYALAYA, CHITTARANJAN
157
Asansol Engineering College
142
Asansol WBPCB Office
95
Evelyn Lodge, Asansol
30
Asansol Court Area, Asansol, India
24
Asansol Court Area, Asansol, India
14
Asansol Court Area, Asansol, India
9
Asansol Court Area, Asansol, India
29
Asansol Court Area, Asansol, India
10
Asansol Court Area, Asansol, India
What cities are near Chittaranjan?
Get AQI alerts for Chittaranjan
Notify me when air quality reaches:
Free · No account · Unsubscribe any time
Data sources: AQI from ground-level monitoring stations via AQICN. Weather forecast from ECMWF (IFS & CAMS models). AQI calculated using US EPA standard. Updated 2026-06-09T05:25 UTC.