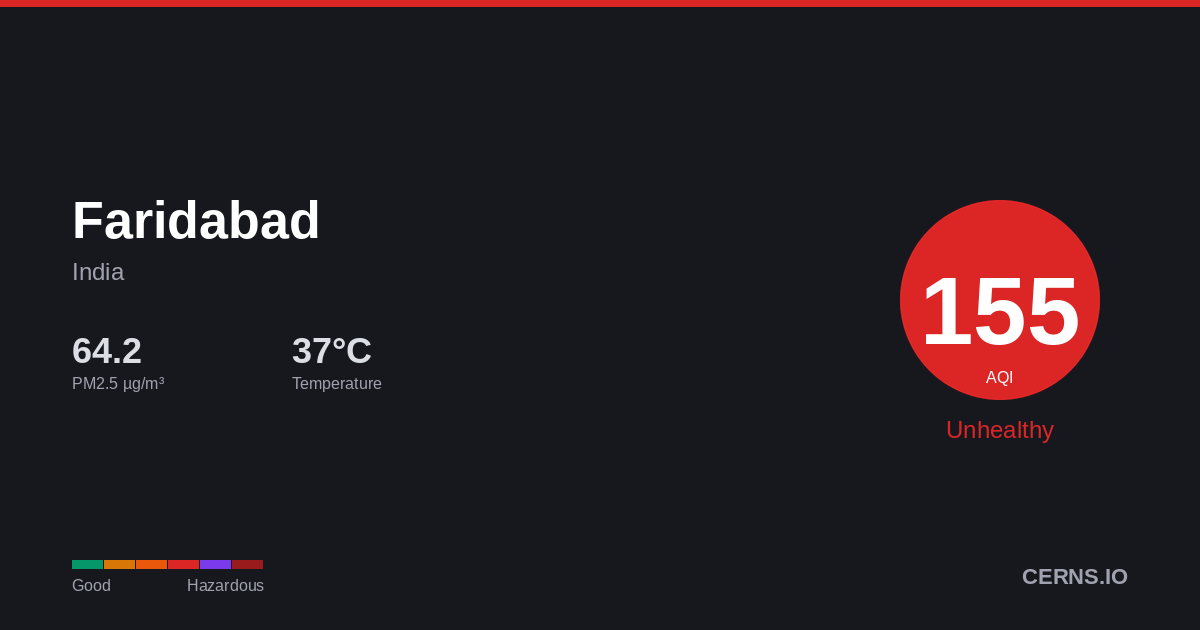
Air Quality in Faridabad, India
Drizzle
37.1°C · 38.4% humidity
37.1°
Feels 37.1°
162
Unhealthy
Everyone should reduce prolonged outdoor exertion.
32 stations
Nearby Monitoring Stations
Faridabad's air quality — share it
AQI Forecast
Calibrated
153
9pm
153
153
162
12am
159
143
141
3am
140
155
154
6am
180
180
179
9am
179
179
166
12pm
166
166
153
3pm
166
153
166
6pm
166
166
Station readings
22h ago
AQI 153
PM2.5 59.9 µg/m³ · 22h ago
Air Quality Index Trend
47h · 61 stnFaridabad's air quality is affected by vehicle emissions, industrial activity, and seasonal crop burning. Air quality typically worsens from November to February due to temperature inversions trapping pollutants near the surface. Current PM2.5 concentration in Faridabad is 5.1× the WHO 24-hour guideline of 15 µg/m³.
38.4%
Humidity
95.8 km/h
Wind NNW
993.7 hPa
Pressure
0.7
UV Low
GoodModerateUSGUnhealthyVery UnhealthyHazardous
Which pollutant is driving the AQI?
PM2.5
76.46 µg/m³
PM10▲
329.9 µg/m³
050100150200300500
What is the weather forecast for Faridabad?
Temperature & Precipitation
PM2.5 Trend
47h · 61 stationsPM2.576.46 µg/m³
×5.1 WHO
Unhealthy
PM10329.9 µg/m³
Unhealthy
UV INDEX0.7
Low
Station readings (32 stations within 25 km)
76.46
Median
83.76
Average
22.1
Low
330.9
High
PM2.5 µg/m³ · Model: 64.32 · Bias: -12.1
What is the 7-day forecast for Faridabad?
06-08
37.6° 31.9°
1.75 mm
06-09
45.2° 37.6°
06-10
44.5° 35.9°
0.13 mm
06-11
44.9° 30.1°
0.19 mm
06-12
43.8° 37.4°
06-13
45.9° 33.8°
0.13 mm
06-14
44.4° 36.5°
0.06 mm
Both models agree
Avg diff: 5.7°C
Where are air quality stations near Faridabad?
17
New Industrial Town, Faridabad, India
34
New Industrial Town, Faridabad, India
42
Sector 11, Faridabad, India
59
Sector 11, Faridabad, India
9
Sector 11, Faridabad, India
11
Sector 11, Faridabad, India
25
Sector 11, Faridabad, India
16
Sector 11, Faridabad, India
14
Nathu Colony, Ballabgarh, India
34
Nathu Colony, Ballabgarh, India
What cities are near Faridabad?
Get AQI alerts for Faridabad
Notify me when air quality reaches:
Free · No account · Unsubscribe any time
Data sources: AQI from ground-level monitoring stations via AQICN. Weather forecast from ECMWF (IFS & CAMS models). AQI calculated using US EPA standard. Updated 2026-06-08T19:32 UTC.